Kenyan vs Immigrants from Portugal Median Female Earnings
COMPARE
Kenyan
Immigrants from Portugal
Median Female Earnings
Median Female Earnings Comparison
Kenyans
Immigrants from Portugal
$39,860
MEDIAN FEMALE EARNINGS
58.4/ 100
METRIC RATING
169th/ 347
METRIC RANK
$39,788
MEDIAN FEMALE EARNINGS
54.7/ 100
METRIC RATING
171st/ 347
METRIC RANK
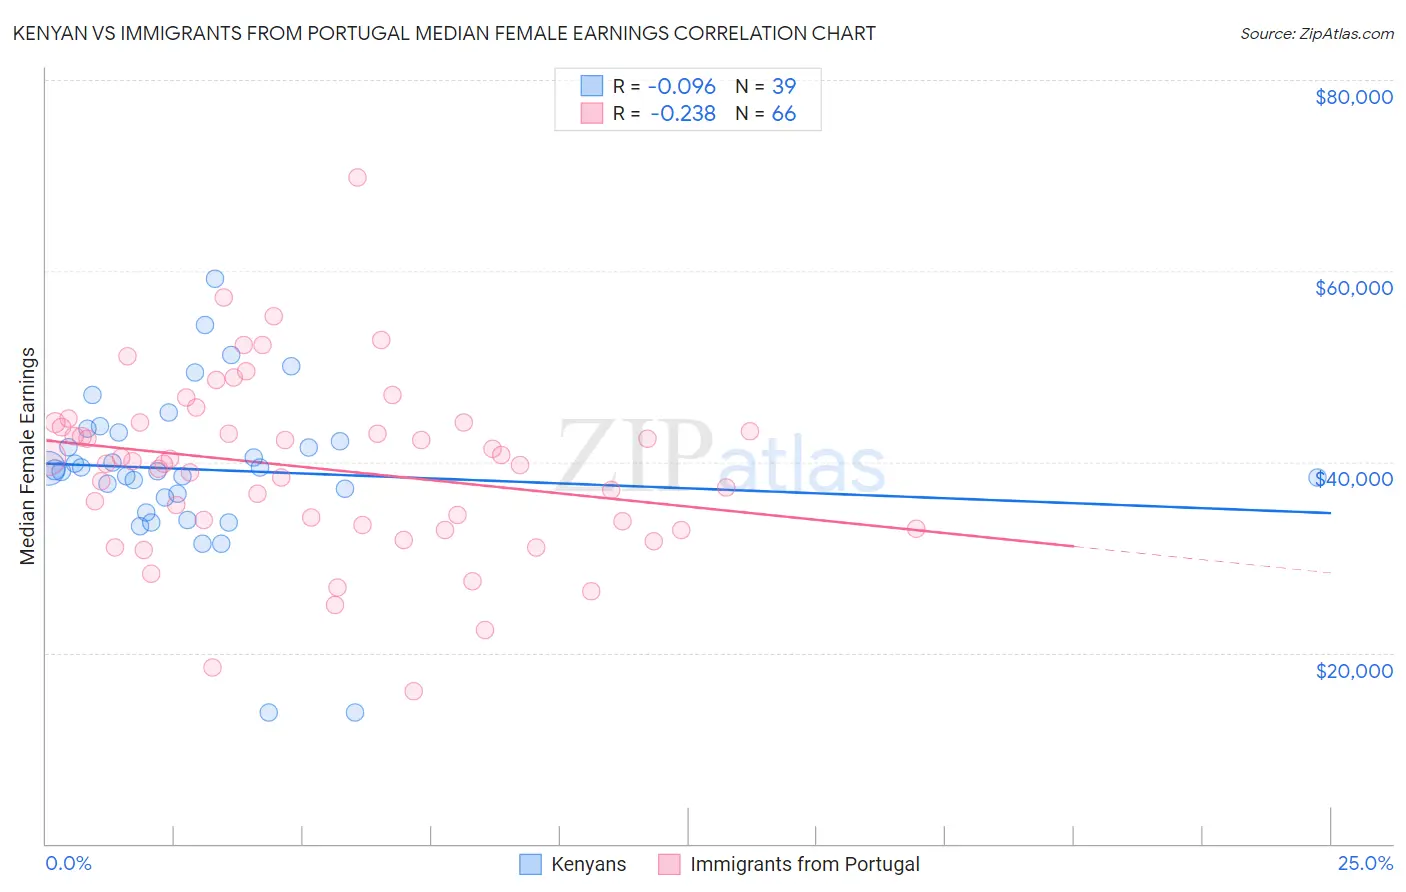
Kenyan vs Immigrants from Portugal Median Female Earnings Correlation Chart
The statistical analysis conducted on geographies consisting of 168,237,877 people shows a slight negative correlation between the proportion of Kenyans and median female earnings in the United States with a correlation coefficient (R) of -0.096 and weighted average of $39,860. Similarly, the statistical analysis conducted on geographies consisting of 174,753,972 people shows a weak negative correlation between the proportion of Immigrants from Portugal and median female earnings in the United States with a correlation coefficient (R) of -0.238 and weighted average of $39,788, a difference of 0.18%.
Median Female Earnings Correlation Summary
| Measurement | Kenyan | Immigrants from Portugal |
| Minimum | $13,750 | $15,996 |
| Maximum | $59,125 | $69,732 |
| Range | $45,375 | $53,736 |
| Mean | $39,183 | $39,346 |
| Median | $39,212 | $39,980 |
| Interquartile 25% (IQ1) | $36,279 | $33,451 |
| Interquartile 75% (IQ3) | $43,131 | $44,115 |
| Interquartile Range (IQR) | $6,851 | $10,664 |
| Standard Deviation (Sample) | $8,498 | $9,199 |
| Standard Deviation (Population) | $8,388 | $9,130 |
Demographics Similar to Kenyans and Immigrants from Portugal by Median Female Earnings
In terms of median female earnings, the demographic groups most similar to Kenyans are Immigrants from Peru ($39,871, a difference of 0.030%), Immigrants from Ghana ($39,894, a difference of 0.080%), Luxembourger ($39,891, a difference of 0.080%), Slovene ($39,817, a difference of 0.11%), and Immigrants from Bangladesh ($39,910, a difference of 0.12%). Similarly, the demographic groups most similar to Immigrants from Portugal are British ($39,772, a difference of 0.040%), Slovene ($39,817, a difference of 0.070%), Canadian ($39,724, a difference of 0.16%), Immigrants from Peru ($39,871, a difference of 0.21%), and South American ($39,698, a difference of 0.23%).
| Demographics | Rating | Rank | Median Female Earnings |
| Inupiat | 68.9 /100 | #160 | Good $40,080 |
| Alsatians | 68.0 /100 | #161 | Good $40,060 |
| South American Indians | 66.1 /100 | #162 | Good $40,019 |
| Lebanese | 65.5 /100 | #163 | Good $40,006 |
| Immigrants | Saudi Arabia | 62.9 /100 | #164 | Good $39,952 |
| Immigrants | Bangladesh | 60.8 /100 | #165 | Good $39,910 |
| Immigrants | Ghana | 60.0 /100 | #166 | Good $39,894 |
| Luxembourgers | 59.9 /100 | #167 | Average $39,891 |
| Immigrants | Peru | 58.9 /100 | #168 | Average $39,871 |
| Kenyans | 58.4 /100 | #169 | Average $39,860 |
| Slovenes | 56.2 /100 | #170 | Average $39,817 |
| Immigrants | Portugal | 54.7 /100 | #171 | Average $39,788 |
| British | 53.8 /100 | #172 | Average $39,772 |
| Canadians | 51.4 /100 | #173 | Average $39,724 |
| South Americans | 50.0 /100 | #174 | Average $39,698 |
| Immigrants | South America | 47.2 /100 | #175 | Average $39,643 |
| Nigerians | 47.0 /100 | #176 | Average $39,641 |
| Costa Ricans | 46.1 /100 | #177 | Average $39,622 |
| Slavs | 45.6 /100 | #178 | Average $39,613 |
| Immigrants | Germany | 45.1 /100 | #179 | Average $39,603 |
| Immigrants | Kenya | 41.6 /100 | #180 | Average $39,535 |