Jordanian vs Greek Receiving Food Stamps
COMPARE
Jordanian
Greek
Receiving Food Stamps
Receiving Food Stamps Comparison
Jordanians
Greeks
10.2%
RECEIVING FOOD STAMPS
97.9/ 100
METRIC RATING
91st/ 347
METRIC RANK
9.7%
RECEIVING FOOD STAMPS
99.3/ 100
METRIC RATING
57th/ 347
METRIC RANK
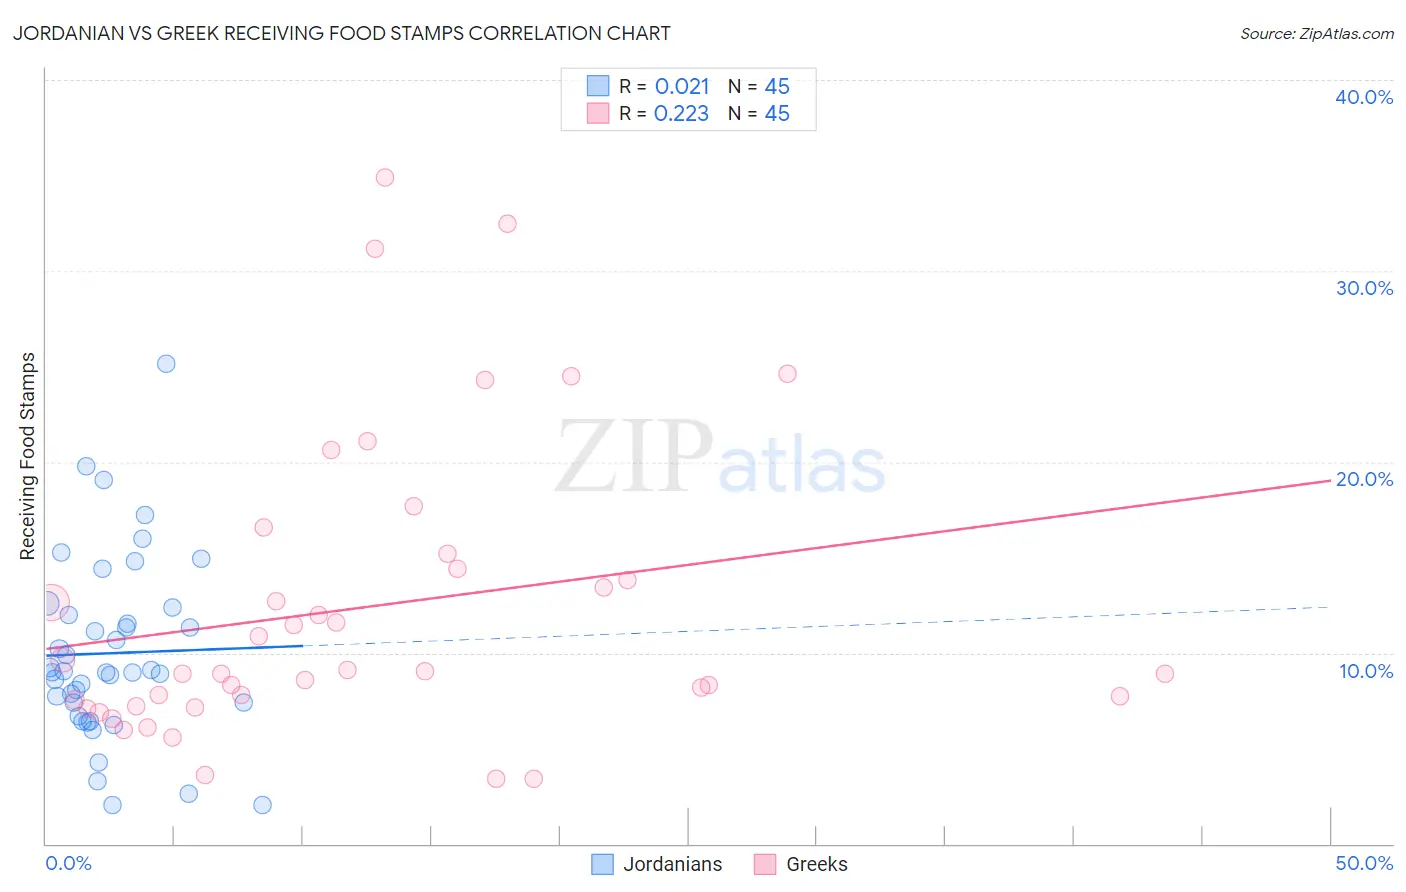
Jordanian vs Greek Receiving Food Stamps Correlation Chart
The statistical analysis conducted on geographies consisting of 166,269,073 people shows no correlation between the proportion of Jordanians and percentage of population receiving government assistance and/or food stamps in the United States with a correlation coefficient (R) of 0.021 and weighted average of 10.2%. Similarly, the statistical analysis conducted on geographies consisting of 480,606,207 people shows a weak positive correlation between the proportion of Greeks and percentage of population receiving government assistance and/or food stamps in the United States with a correlation coefficient (R) of 0.223 and weighted average of 9.7%, a difference of 4.5%.
Receiving Food Stamps Correlation Summary
| Measurement | Jordanian | Greek |
| Minimum | 2.0% | 3.4% |
| Maximum | 25.2% | 34.9% |
| Range | 23.2% | 31.5% |
| Mean | 10.0% | 12.4% |
| Median | 9.0% | 9.0% |
| Interquartile 25% (IQ1) | 7.0% | 7.4% |
| Interquartile 75% (IQ3) | 12.2% | 14.8% |
| Interquartile Range (IQR) | 5.2% | 7.4% |
| Standard Deviation (Sample) | 4.8% | 7.7% |
| Standard Deviation (Population) | 4.7% | 7.7% |
Similar Demographics by Receiving Food Stamps
Demographics Similar to Jordanians by Receiving Food Stamps
In terms of receiving food stamps, the demographic groups most similar to Jordanians are Irish (10.2%, a difference of 0.0%), Finnish (10.2%, a difference of 0.040%), Belgian (10.2%, a difference of 0.39%), Immigrants from France (10.1%, a difference of 0.89%), and Immigrants from Greece (10.3%, a difference of 0.91%).
| Demographics | Rating | Rank | Receiving Food Stamps |
| Immigrants | Israel | 98.5 /100 | #84 | Exceptional 10.0% |
| Immigrants | Romania | 98.5 /100 | #85 | Exceptional 10.0% |
| Immigrants | Norway | 98.4 /100 | #86 | Exceptional 10.0% |
| Egyptians | 98.4 /100 | #87 | Exceptional 10.0% |
| Immigrants | Kuwait | 98.4 /100 | #88 | Exceptional 10.0% |
| Immigrants | France | 98.3 /100 | #89 | Exceptional 10.1% |
| Finns | 97.9 /100 | #90 | Exceptional 10.2% |
| Jordanians | 97.9 /100 | #91 | Exceptional 10.2% |
| Irish | 97.9 /100 | #92 | Exceptional 10.2% |
| Belgians | 97.7 /100 | #93 | Exceptional 10.2% |
| Immigrants | Greece | 97.4 /100 | #94 | Exceptional 10.3% |
| Basques | 97.4 /100 | #95 | Exceptional 10.3% |
| Welsh | 97.3 /100 | #96 | Exceptional 10.3% |
| Czechoslovakians | 97.2 /100 | #97 | Exceptional 10.3% |
| Immigrants | Egypt | 97.1 /100 | #98 | Exceptional 10.3% |
Demographics Similar to Greeks by Receiving Food Stamps
In terms of receiving food stamps, the demographic groups most similar to Greeks are Scandinavian (9.7%, a difference of 0.060%), British (9.7%, a difference of 0.090%), Immigrants from Canada (9.7%, a difference of 0.11%), German (9.7%, a difference of 0.19%), and Immigrants from Switzerland (9.7%, a difference of 0.29%).
| Demographics | Rating | Rank | Receiving Food Stamps |
| Lithuanians | 99.4 /100 | #50 | Exceptional 9.7% |
| Asians | 99.3 /100 | #51 | Exceptional 9.7% |
| Immigrants | South Africa | 99.3 /100 | #52 | Exceptional 9.7% |
| Tongans | 99.3 /100 | #53 | Exceptional 9.7% |
| Swiss | 99.3 /100 | #54 | Exceptional 9.7% |
| Immigrants | Switzerland | 99.3 /100 | #55 | Exceptional 9.7% |
| Immigrants | Canada | 99.3 /100 | #56 | Exceptional 9.7% |
| Greeks | 99.3 /100 | #57 | Exceptional 9.7% |
| Scandinavians | 99.2 /100 | #58 | Exceptional 9.7% |
| British | 99.2 /100 | #59 | Exceptional 9.7% |
| Germans | 99.2 /100 | #60 | Exceptional 9.7% |
| English | 99.2 /100 | #61 | Exceptional 9.8% |
| Immigrants | Bulgaria | 99.2 /100 | #62 | Exceptional 9.8% |
| Chinese | 99.2 /100 | #63 | Exceptional 9.8% |
| Immigrants | North America | 99.2 /100 | #64 | Exceptional 9.8% |