Jordanian vs Greek In Labor Force | Age 25-29
COMPARE
Jordanian
Greek
In Labor Force | Age 25-29
In Labor Force | Age 25-29 Comparison
Jordanians
Greeks
84.2%
IN LABOR FORCE | AGE 25-29
6.7/ 100
METRIC RATING
222nd/ 347
METRIC RANK
85.5%
IN LABOR FORCE | AGE 25-29
99.6/ 100
METRIC RATING
58th/ 347
METRIC RANK
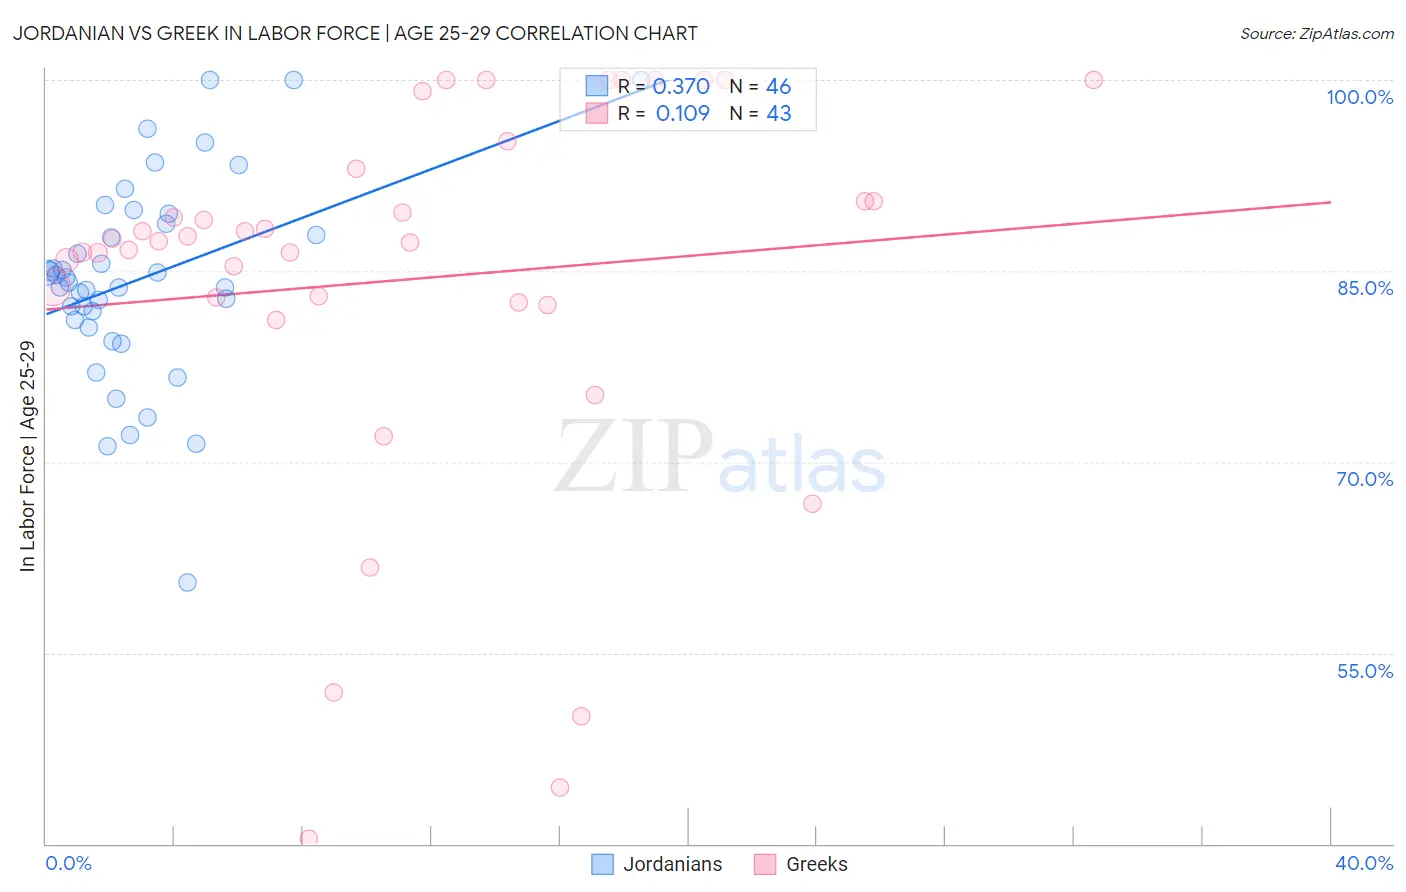
Jordanian vs Greek In Labor Force | Age 25-29 Correlation Chart
The statistical analysis conducted on geographies consisting of 166,391,810 people shows a mild positive correlation between the proportion of Jordanians and labor force participation rate among population between the ages 25 and 29 in the United States with a correlation coefficient (R) of 0.370 and weighted average of 84.2%. Similarly, the statistical analysis conducted on geographies consisting of 482,434,126 people shows a poor positive correlation between the proportion of Greeks and labor force participation rate among population between the ages 25 and 29 in the United States with a correlation coefficient (R) of 0.109 and weighted average of 85.5%, a difference of 1.5%.
In Labor Force | Age 25-29 Correlation Summary
| Measurement | Jordanian | Greek |
| Minimum | 60.5% | 40.4% |
| Maximum | 100.0% | 100.0% |
| Range | 39.5% | 59.6% |
| Mean | 84.4% | 84.3% |
| Median | 84.3% | 87.3% |
| Interquartile 25% (IQ1) | 81.2% | 82.6% |
| Interquartile 75% (IQ3) | 88.8% | 93.1% |
| Interquartile Range (IQR) | 7.6% | 10.5% |
| Standard Deviation (Sample) | 7.9% | 15.0% |
| Standard Deviation (Population) | 7.8% | 14.8% |
Similar Demographics by In Labor Force | Age 25-29
Demographics Similar to Jordanians by In Labor Force | Age 25-29
In terms of in labor force | age 25-29, the demographic groups most similar to Jordanians are Arab (84.2%, a difference of 0.0%), Nigerian (84.3%, a difference of 0.010%), Scotch-Irish (84.2%, a difference of 0.010%), Immigrants from West Indies (84.2%, a difference of 0.020%), and Korean (84.2%, a difference of 0.030%).
| Demographics | Rating | Rank | In Labor Force | Age 25-29 |
| Immigrants | Syria | 10.7 /100 | #215 | Poor 84.3% |
| Israelis | 9.3 /100 | #216 | Tragic 84.3% |
| Immigrants | Ecuador | 9.3 /100 | #217 | Tragic 84.3% |
| Immigrants | Nigeria | 9.0 /100 | #218 | Tragic 84.3% |
| Immigrants | Saudi Arabia | 8.8 /100 | #219 | Tragic 84.3% |
| Nigerians | 7.2 /100 | #220 | Tragic 84.3% |
| Arabs | 6.8 /100 | #221 | Tragic 84.2% |
| Jordanians | 6.7 /100 | #222 | Tragic 84.2% |
| Scotch-Irish | 6.5 /100 | #223 | Tragic 84.2% |
| Immigrants | West Indies | 6.0 /100 | #224 | Tragic 84.2% |
| Koreans | 5.9 /100 | #225 | Tragic 84.2% |
| Immigrants | Congo | 5.8 /100 | #226 | Tragic 84.2% |
| French American Indians | 5.5 /100 | #227 | Tragic 84.2% |
| Immigrants | Panama | 5.5 /100 | #228 | Tragic 84.2% |
| Immigrants | Oceania | 5.0 /100 | #229 | Tragic 84.2% |
Demographics Similar to Greeks by In Labor Force | Age 25-29
In terms of in labor force | age 25-29, the demographic groups most similar to Greeks are Eastern European (85.5%, a difference of 0.010%), Estonian (85.5%, a difference of 0.010%), Immigrants from Morocco (85.5%, a difference of 0.010%), Thai (85.5%, a difference of 0.040%), and Serbian (85.5%, a difference of 0.040%).
| Demographics | Rating | Rank | In Labor Force | Age 25-29 |
| Immigrants | Latvia | 99.8 /100 | #51 | Exceptional 85.6% |
| Immigrants | Poland | 99.7 /100 | #52 | Exceptional 85.6% |
| Belgians | 99.7 /100 | #53 | Exceptional 85.5% |
| Albanians | 99.7 /100 | #54 | Exceptional 85.5% |
| Immigrants | Brazil | 99.7 /100 | #55 | Exceptional 85.5% |
| Eastern Europeans | 99.6 /100 | #56 | Exceptional 85.5% |
| Estonians | 99.6 /100 | #57 | Exceptional 85.5% |
| Greeks | 99.6 /100 | #58 | Exceptional 85.5% |
| Immigrants | Morocco | 99.5 /100 | #59 | Exceptional 85.5% |
| Thais | 99.5 /100 | #60 | Exceptional 85.5% |
| Serbians | 99.5 /100 | #61 | Exceptional 85.5% |
| Taiwanese | 99.4 /100 | #62 | Exceptional 85.4% |
| Immigrants | Kenya | 99.4 /100 | #63 | Exceptional 85.4% |
| Immigrants | Italy | 99.3 /100 | #64 | Exceptional 85.4% |
| Immigrants | Czechoslovakia | 99.3 /100 | #65 | Exceptional 85.4% |