Italian vs Immigrants from England Family Poverty
COMPARE
Italian
Immigrants from England
Family Poverty
Family Poverty Comparison
Italians
Immigrants from England
7.4%
FAMILY POVERTY
99.6/ 100
METRIC RATING
30th/ 347
METRIC RANK
8.0%
FAMILY POVERTY
97.1/ 100
METRIC RATING
90th/ 347
METRIC RANK
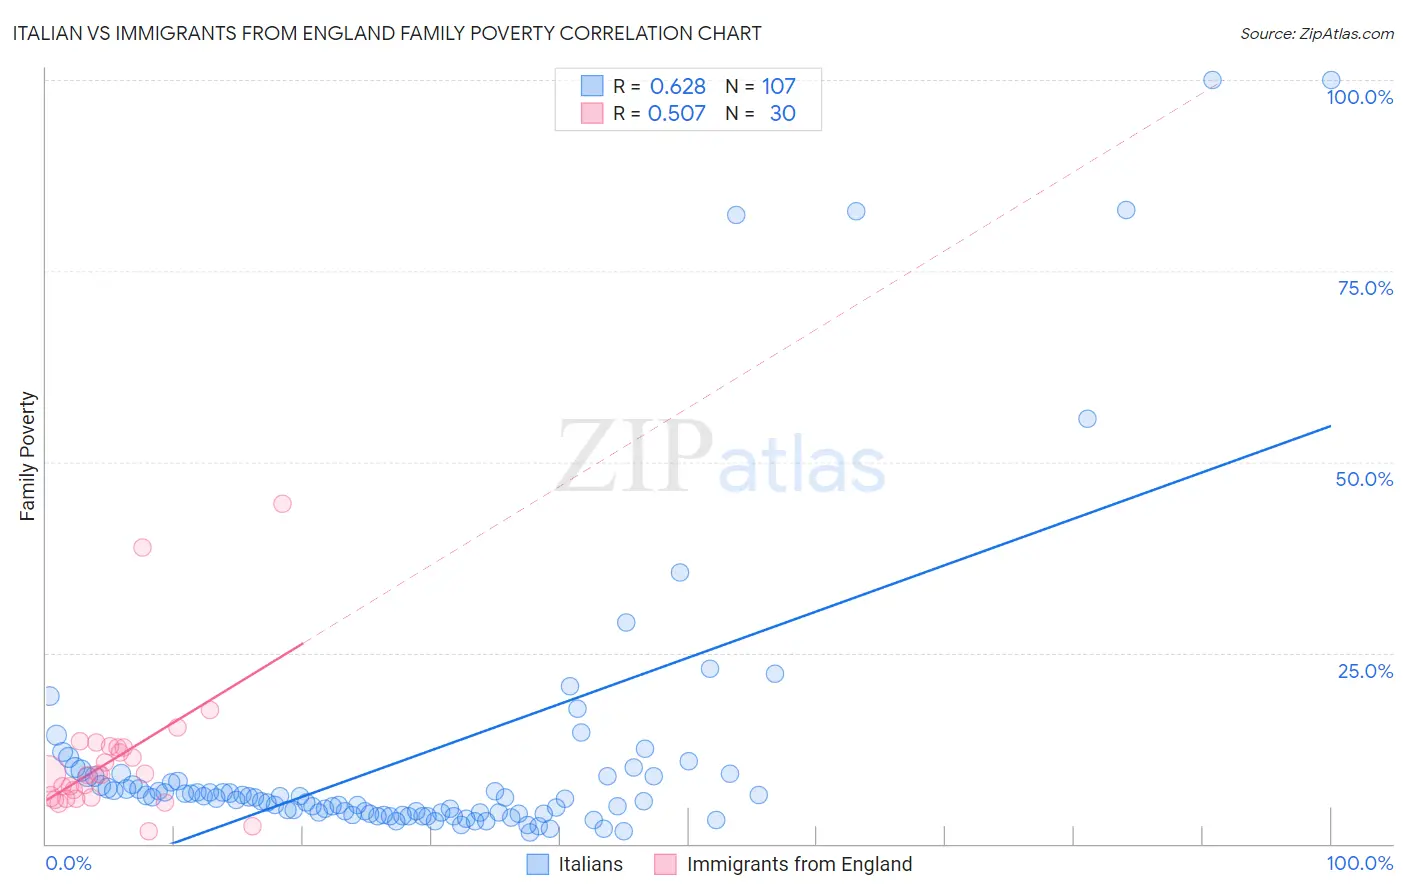
Italian vs Immigrants from England Family Poverty Correlation Chart
The statistical analysis conducted on geographies consisting of 569,861,523 people shows a significant positive correlation between the proportion of Italians and poverty level among families in the United States with a correlation coefficient (R) of 0.628 and weighted average of 7.4%. Similarly, the statistical analysis conducted on geographies consisting of 390,846,172 people shows a substantial positive correlation between the proportion of Immigrants from England and poverty level among families in the United States with a correlation coefficient (R) of 0.507 and weighted average of 8.0%, a difference of 7.6%.
Family Poverty Correlation Summary
| Measurement | Italian | Immigrants from England |
| Minimum | 1.5% | 1.6% |
| Maximum | 100.0% | 44.4% |
| Range | 98.5% | 42.8% |
| Mean | 11.4% | 11.1% |
| Median | 6.1% | 9.0% |
| Interquartile 25% (IQ1) | 4.0% | 6.1% |
| Interquartile 75% (IQ3) | 8.8% | 12.6% |
| Interquartile Range (IQR) | 4.8% | 6.5% |
| Standard Deviation (Sample) | 18.9% | 9.1% |
| Standard Deviation (Population) | 18.8% | 8.9% |
Similar Demographics by Family Poverty
Demographics Similar to Italians by Family Poverty
In terms of family poverty, the demographic groups most similar to Italians are Czech (7.4%, a difference of 0.12%), Immigrants from Northern Europe (7.4%, a difference of 0.29%), Polish (7.4%, a difference of 0.42%), Immigrants from Japan (7.4%, a difference of 0.42%), and Immigrants from Korea (7.4%, a difference of 0.46%).
| Demographics | Rating | Rank | Family Poverty |
| Assyrians/Chaldeans/Syriacs | 99.7 /100 | #23 | Exceptional 7.3% |
| Croatians | 99.7 /100 | #24 | Exceptional 7.3% |
| Burmese | 99.7 /100 | #25 | Exceptional 7.3% |
| Cypriots | 99.6 /100 | #26 | Exceptional 7.3% |
| Immigrants | Scotland | 99.6 /100 | #27 | Exceptional 7.3% |
| Immigrants | Korea | 99.6 /100 | #28 | Exceptional 7.4% |
| Immigrants | Northern Europe | 99.6 /100 | #29 | Exceptional 7.4% |
| Italians | 99.6 /100 | #30 | Exceptional 7.4% |
| Czechs | 99.6 /100 | #31 | Exceptional 7.4% |
| Poles | 99.5 /100 | #32 | Exceptional 7.4% |
| Immigrants | Japan | 99.5 /100 | #33 | Exceptional 7.4% |
| Russians | 99.5 /100 | #34 | Exceptional 7.5% |
| Greeks | 99.4 /100 | #35 | Exceptional 7.5% |
| Turks | 99.4 /100 | #36 | Exceptional 7.5% |
| Estonians | 99.4 /100 | #37 | Exceptional 7.5% |
Demographics Similar to Immigrants from England by Family Poverty
In terms of family poverty, the demographic groups most similar to Immigrants from England are Immigrants from Denmark (8.0%, a difference of 0.0%), Serbian (8.0%, a difference of 0.15%), Immigrants from Italy (8.0%, a difference of 0.16%), Belgian (8.0%, a difference of 0.21%), and Scottish (7.9%, a difference of 0.30%).
| Demographics | Rating | Rank | Family Poverty |
| Slovaks | 97.7 /100 | #83 | Exceptional 7.9% |
| British | 97.5 /100 | #84 | Exceptional 7.9% |
| Immigrants | Asia | 97.4 /100 | #85 | Exceptional 7.9% |
| Scottish | 97.3 /100 | #86 | Exceptional 7.9% |
| Belgians | 97.3 /100 | #87 | Exceptional 8.0% |
| Serbians | 97.2 /100 | #88 | Exceptional 8.0% |
| Immigrants | Denmark | 97.1 /100 | #89 | Exceptional 8.0% |
| Immigrants | England | 97.1 /100 | #90 | Exceptional 8.0% |
| Immigrants | Italy | 97.0 /100 | #91 | Exceptional 8.0% |
| Czechoslovakians | 96.8 /100 | #92 | Exceptional 8.0% |
| Tlingit-Haida | 96.7 /100 | #93 | Exceptional 8.0% |
| Immigrants | Pakistan | 96.6 /100 | #94 | Exceptional 8.0% |
| Immigrants | Philippines | 96.5 /100 | #95 | Exceptional 8.0% |
| Immigrants | Turkey | 96.5 /100 | #96 | Exceptional 8.0% |
| Immigrants | Switzerland | 96.1 /100 | #97 | Exceptional 8.1% |