Jamaican vs Immigrants from England Family Poverty
COMPARE
Jamaican
Immigrants from England
Family Poverty
Family Poverty Comparison
Jamaicans
Immigrants from England
11.1%
FAMILY POVERTY
0.1/ 100
METRIC RATING
268th/ 347
METRIC RANK
8.0%
FAMILY POVERTY
97.1/ 100
METRIC RATING
90th/ 347
METRIC RANK
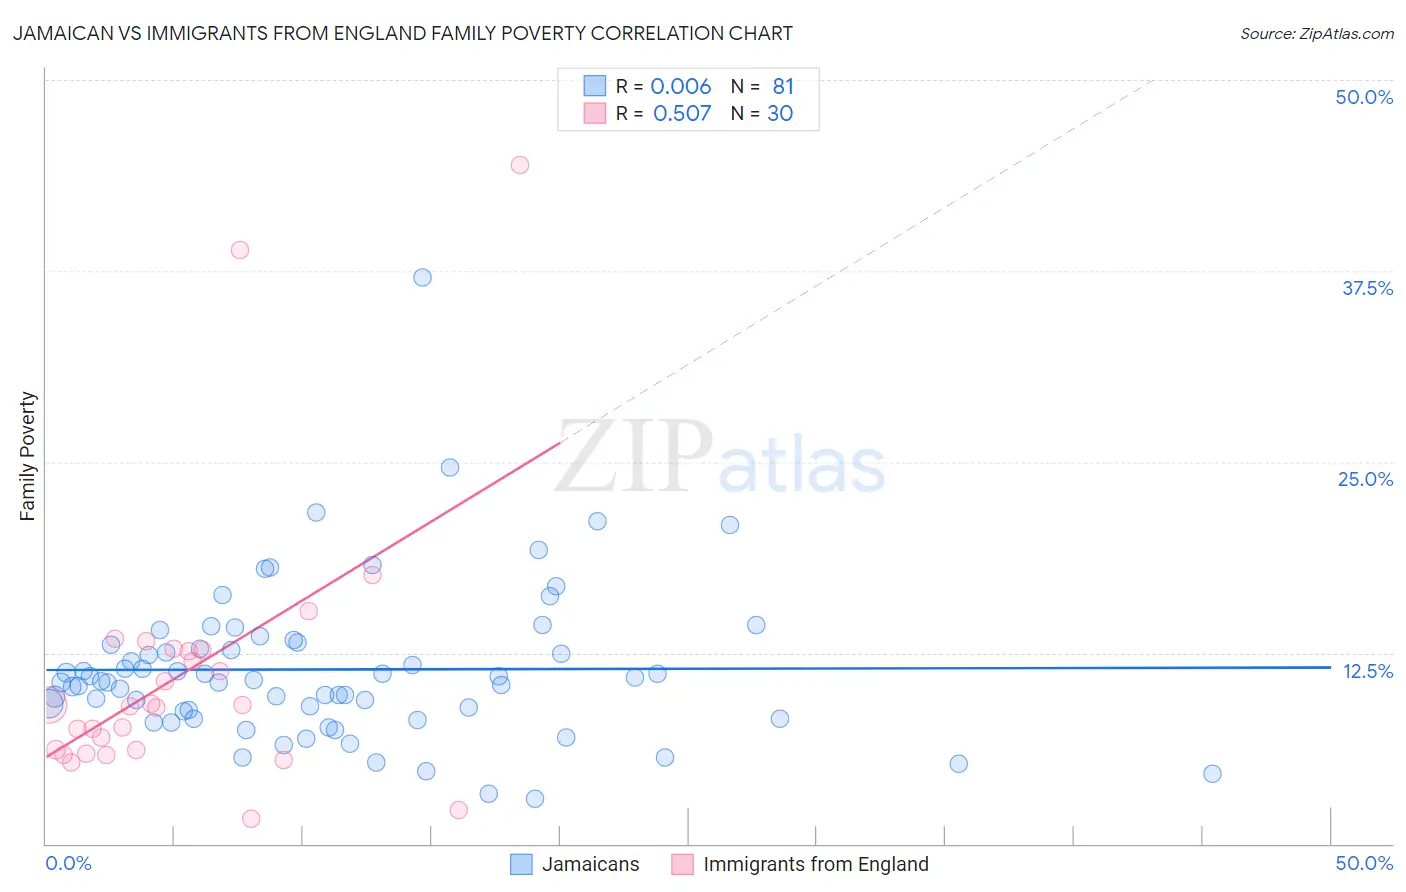
Jamaican vs Immigrants from England Family Poverty Correlation Chart
The statistical analysis conducted on geographies consisting of 367,005,969 people shows no correlation between the proportion of Jamaicans and poverty level among families in the United States with a correlation coefficient (R) of 0.006 and weighted average of 11.1%. Similarly, the statistical analysis conducted on geographies consisting of 390,846,172 people shows a substantial positive correlation between the proportion of Immigrants from England and poverty level among families in the United States with a correlation coefficient (R) of 0.507 and weighted average of 8.0%, a difference of 38.8%.
Family Poverty Correlation Summary
| Measurement | Jamaican | Immigrants from England |
| Minimum | 3.0% | 1.6% |
| Maximum | 37.0% | 44.4% |
| Range | 34.1% | 42.8% |
| Mean | 11.4% | 11.1% |
| Median | 10.6% | 9.0% |
| Interquartile 25% (IQ1) | 8.5% | 6.1% |
| Interquartile 75% (IQ3) | 13.1% | 12.6% |
| Interquartile Range (IQR) | 4.6% | 6.5% |
| Standard Deviation (Sample) | 5.1% | 9.1% |
| Standard Deviation (Population) | 5.1% | 8.9% |
Similar Demographics by Family Poverty
Demographics Similar to Jamaicans by Family Poverty
In terms of family poverty, the demographic groups most similar to Jamaicans are Comanche (11.0%, a difference of 0.10%), Immigrants from El Salvador (11.0%, a difference of 0.12%), Immigrants from Ecuador (11.1%, a difference of 0.48%), Immigrants from Nicaragua (11.1%, a difference of 0.49%), and Immigrants from Bahamas (11.1%, a difference of 0.73%).
| Demographics | Rating | Rank | Family Poverty |
| Shoshone | 0.2 /100 | #261 | Tragic 10.9% |
| Spanish American Indians | 0.2 /100 | #262 | Tragic 10.9% |
| Cape Verdeans | 0.1 /100 | #263 | Tragic 10.9% |
| Trinidadians and Tobagonians | 0.1 /100 | #264 | Tragic 10.9% |
| Immigrants | Trinidad and Tobago | 0.1 /100 | #265 | Tragic 10.9% |
| Immigrants | El Salvador | 0.1 /100 | #266 | Tragic 11.0% |
| Comanche | 0.1 /100 | #267 | Tragic 11.0% |
| Jamaicans | 0.1 /100 | #268 | Tragic 11.1% |
| Immigrants | Ecuador | 0.1 /100 | #269 | Tragic 11.1% |
| Immigrants | Nicaragua | 0.1 /100 | #270 | Tragic 11.1% |
| Immigrants | Bahamas | 0.1 /100 | #271 | Tragic 11.1% |
| Immigrants | Jamaica | 0.1 /100 | #272 | Tragic 11.2% |
| Somalis | 0.1 /100 | #273 | Tragic 11.2% |
| Spanish Americans | 0.1 /100 | #274 | Tragic 11.2% |
| Central Americans | 0.1 /100 | #275 | Tragic 11.2% |
Demographics Similar to Immigrants from England by Family Poverty
In terms of family poverty, the demographic groups most similar to Immigrants from England are Immigrants from Denmark (8.0%, a difference of 0.0%), Serbian (8.0%, a difference of 0.15%), Immigrants from Italy (8.0%, a difference of 0.16%), Belgian (8.0%, a difference of 0.21%), and Scottish (7.9%, a difference of 0.30%).
| Demographics | Rating | Rank | Family Poverty |
| Slovaks | 97.7 /100 | #83 | Exceptional 7.9% |
| British | 97.5 /100 | #84 | Exceptional 7.9% |
| Immigrants | Asia | 97.4 /100 | #85 | Exceptional 7.9% |
| Scottish | 97.3 /100 | #86 | Exceptional 7.9% |
| Belgians | 97.3 /100 | #87 | Exceptional 8.0% |
| Serbians | 97.2 /100 | #88 | Exceptional 8.0% |
| Immigrants | Denmark | 97.1 /100 | #89 | Exceptional 8.0% |
| Immigrants | England | 97.1 /100 | #90 | Exceptional 8.0% |
| Immigrants | Italy | 97.0 /100 | #91 | Exceptional 8.0% |
| Czechoslovakians | 96.8 /100 | #92 | Exceptional 8.0% |
| Tlingit-Haida | 96.7 /100 | #93 | Exceptional 8.0% |
| Immigrants | Pakistan | 96.6 /100 | #94 | Exceptional 8.0% |
| Immigrants | Philippines | 96.5 /100 | #95 | Exceptional 8.0% |
| Immigrants | Turkey | 96.5 /100 | #96 | Exceptional 8.0% |
| Immigrants | Switzerland | 96.1 /100 | #97 | Exceptional 8.1% |