German vs Immigrants from England Family Poverty
COMPARE
German
Immigrants from England
Family Poverty
Family Poverty Comparison
Germans
Immigrants from England
7.7%
FAMILY POVERTY
99.0/ 100
METRIC RATING
44th/ 347
METRIC RANK
8.0%
FAMILY POVERTY
97.1/ 100
METRIC RATING
90th/ 347
METRIC RANK
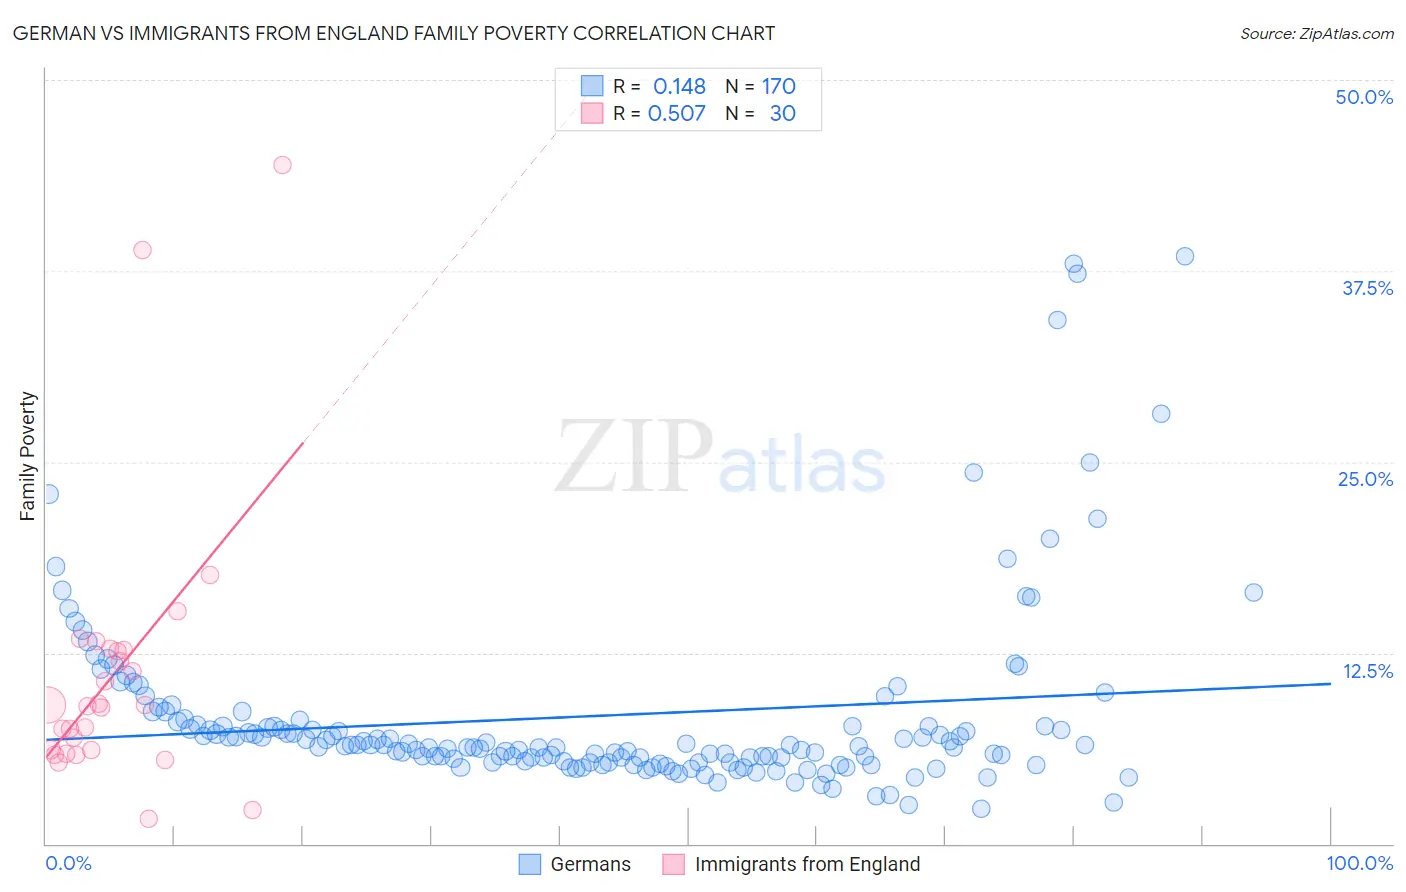
German vs Immigrants from England Family Poverty Correlation Chart
The statistical analysis conducted on geographies consisting of 575,144,438 people shows a poor positive correlation between the proportion of Germans and poverty level among families in the United States with a correlation coefficient (R) of 0.148 and weighted average of 7.7%. Similarly, the statistical analysis conducted on geographies consisting of 390,846,172 people shows a substantial positive correlation between the proportion of Immigrants from England and poverty level among families in the United States with a correlation coefficient (R) of 0.507 and weighted average of 8.0%, a difference of 4.1%.
Family Poverty Correlation Summary
| Measurement | German | Immigrants from England |
| Minimum | 2.3% | 1.6% |
| Maximum | 38.5% | 44.4% |
| Range | 36.2% | 42.8% |
| Mean | 8.4% | 11.1% |
| Median | 6.4% | 9.0% |
| Interquartile 25% (IQ1) | 5.4% | 6.1% |
| Interquartile 75% (IQ3) | 7.8% | 12.6% |
| Interquartile Range (IQR) | 2.4% | 6.5% |
| Standard Deviation (Sample) | 6.1% | 9.1% |
| Standard Deviation (Population) | 6.1% | 8.9% |
Similar Demographics by Family Poverty
Demographics Similar to Germans by Family Poverty
In terms of family poverty, the demographic groups most similar to Germans are Okinawan (7.7%, a difference of 0.12%), Tongan (7.7%, a difference of 0.14%), Immigrants from Czechoslovakia (7.7%, a difference of 0.15%), Immigrants from Sri Lanka (7.7%, a difference of 0.17%), and Immigrants from Austria (7.6%, a difference of 0.29%).
| Demographics | Rating | Rank | Family Poverty |
| Estonians | 99.4 /100 | #37 | Exceptional 7.5% |
| Bolivians | 99.3 /100 | #38 | Exceptional 7.5% |
| Carpatho Rusyns | 99.3 /100 | #39 | Exceptional 7.5% |
| Slovenes | 99.3 /100 | #40 | Exceptional 7.5% |
| Immigrants | Australia | 99.2 /100 | #41 | Exceptional 7.6% |
| Scandinavians | 99.1 /100 | #42 | Exceptional 7.6% |
| Immigrants | Austria | 99.1 /100 | #43 | Exceptional 7.6% |
| Germans | 99.0 /100 | #44 | Exceptional 7.7% |
| Okinawans | 98.9 /100 | #45 | Exceptional 7.7% |
| Tongans | 98.9 /100 | #46 | Exceptional 7.7% |
| Immigrants | Czechoslovakia | 98.9 /100 | #47 | Exceptional 7.7% |
| Immigrants | Sri Lanka | 98.9 /100 | #48 | Exceptional 7.7% |
| Immigrants | Bolivia | 98.9 /100 | #49 | Exceptional 7.7% |
| Immigrants | North Macedonia | 98.9 /100 | #50 | Exceptional 7.7% |
| Immigrants | Moldova | 98.8 /100 | #51 | Exceptional 7.7% |
Demographics Similar to Immigrants from England by Family Poverty
In terms of family poverty, the demographic groups most similar to Immigrants from England are Immigrants from Denmark (8.0%, a difference of 0.0%), Serbian (8.0%, a difference of 0.15%), Immigrants from Italy (8.0%, a difference of 0.16%), Belgian (8.0%, a difference of 0.21%), and Scottish (7.9%, a difference of 0.30%).
| Demographics | Rating | Rank | Family Poverty |
| Slovaks | 97.7 /100 | #83 | Exceptional 7.9% |
| British | 97.5 /100 | #84 | Exceptional 7.9% |
| Immigrants | Asia | 97.4 /100 | #85 | Exceptional 7.9% |
| Scottish | 97.3 /100 | #86 | Exceptional 7.9% |
| Belgians | 97.3 /100 | #87 | Exceptional 8.0% |
| Serbians | 97.2 /100 | #88 | Exceptional 8.0% |
| Immigrants | Denmark | 97.1 /100 | #89 | Exceptional 8.0% |
| Immigrants | England | 97.1 /100 | #90 | Exceptional 8.0% |
| Immigrants | Italy | 97.0 /100 | #91 | Exceptional 8.0% |
| Czechoslovakians | 96.8 /100 | #92 | Exceptional 8.0% |
| Tlingit-Haida | 96.7 /100 | #93 | Exceptional 8.0% |
| Immigrants | Pakistan | 96.6 /100 | #94 | Exceptional 8.0% |
| Immigrants | Philippines | 96.5 /100 | #95 | Exceptional 8.0% |
| Immigrants | Turkey | 96.5 /100 | #96 | Exceptional 8.0% |
| Immigrants | Switzerland | 96.1 /100 | #97 | Exceptional 8.1% |