Israeli vs Korean Single Female Poverty
COMPARE
Israeli
Korean
Single Female Poverty
Single Female Poverty Comparison
Israelis
Koreans
19.9%
SINGLE FEMALE POVERTY
96.9/ 100
METRIC RATING
105th/ 347
METRIC RANK
18.6%
SINGLE FEMALE POVERTY
99.9/ 100
METRIC RATING
34th/ 347
METRIC RANK
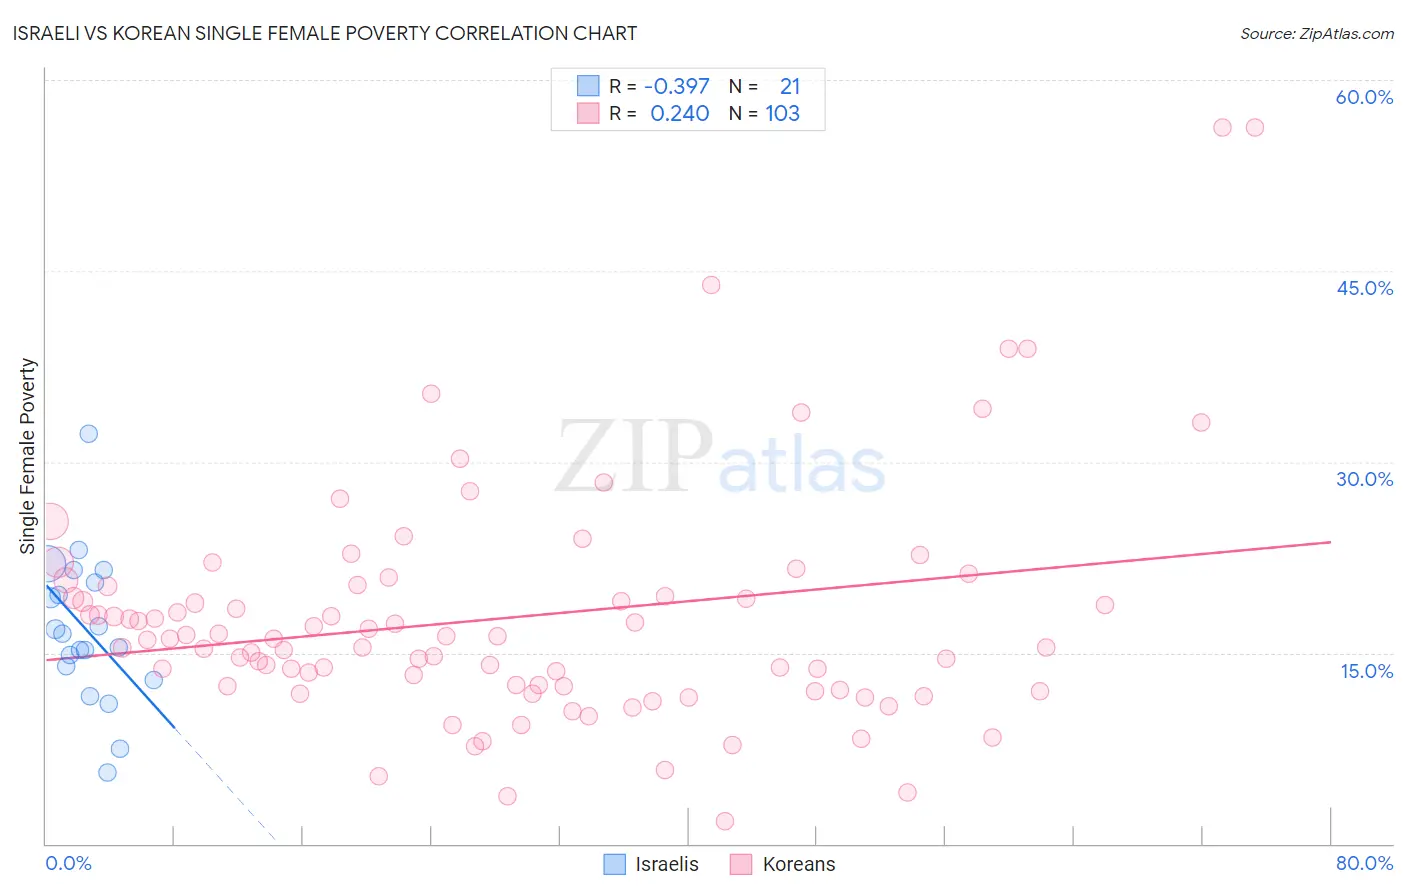
Israeli vs Korean Single Female Poverty Correlation Chart
The statistical analysis conducted on geographies consisting of 208,686,807 people shows a mild negative correlation between the proportion of Israelis and poverty level among single females in the United States with a correlation coefficient (R) of -0.397 and weighted average of 19.9%. Similarly, the statistical analysis conducted on geographies consisting of 499,036,365 people shows a weak positive correlation between the proportion of Koreans and poverty level among single females in the United States with a correlation coefficient (R) of 0.240 and weighted average of 18.6%, a difference of 6.8%.
Single Female Poverty Correlation Summary
| Measurement | Israeli | Korean |
| Minimum | 5.6% | 1.8% |
| Maximum | 32.2% | 56.2% |
| Range | 26.6% | 54.5% |
| Mean | 16.8% | 17.8% |
| Median | 16.5% | 16.1% |
| Interquartile 25% (IQ1) | 13.4% | 12.4% |
| Interquartile 75% (IQ3) | 21.0% | 20.2% |
| Interquartile Range (IQR) | 7.6% | 7.8% |
| Standard Deviation (Sample) | 5.8% | 9.3% |
| Standard Deviation (Population) | 5.7% | 9.3% |
Similar Demographics by Single Female Poverty
Demographics Similar to Israelis by Single Female Poverty
In terms of single female poverty, the demographic groups most similar to Israelis are Chilean (19.9%, a difference of 0.010%), Ethiopian (19.9%, a difference of 0.090%), Immigrants from Syria (19.9%, a difference of 0.11%), Immigrants from Southern Europe (19.9%, a difference of 0.13%), and Native Hawaiian (19.9%, a difference of 0.16%).
| Demographics | Rating | Rank | Single Female Poverty |
| Immigrants | France | 97.9 /100 | #98 | Exceptional 19.7% |
| Sierra Leoneans | 97.9 /100 | #99 | Exceptional 19.7% |
| Ukrainians | 97.6 /100 | #100 | Exceptional 19.8% |
| Immigrants | Belgium | 97.3 /100 | #101 | Exceptional 19.8% |
| Immigrants | Cameroon | 97.3 /100 | #102 | Exceptional 19.8% |
| Immigrants | Southern Europe | 97.1 /100 | #103 | Exceptional 19.9% |
| Chileans | 96.9 /100 | #104 | Exceptional 19.9% |
| Israelis | 96.9 /100 | #105 | Exceptional 19.9% |
| Ethiopians | 96.7 /100 | #106 | Exceptional 19.9% |
| Immigrants | Syria | 96.7 /100 | #107 | Exceptional 19.9% |
| Native Hawaiians | 96.6 /100 | #108 | Exceptional 19.9% |
| Colombians | 96.6 /100 | #109 | Exceptional 19.9% |
| Immigrants | Western Asia | 96.5 /100 | #110 | Exceptional 19.9% |
| Carpatho Rusyns | 96.1 /100 | #111 | Exceptional 20.0% |
| Immigrants | Netherlands | 96.0 /100 | #112 | Exceptional 20.0% |
Demographics Similar to Koreans by Single Female Poverty
In terms of single female poverty, the demographic groups most similar to Koreans are Immigrants from Japan (18.6%, a difference of 0.060%), Immigrants from Philippines (18.6%, a difference of 0.18%), Turkish (18.7%, a difference of 0.24%), Immigrants from Sri Lanka (18.6%, a difference of 0.25%), and Immigrants from Armenia (18.7%, a difference of 0.26%).
| Demographics | Rating | Rank | Single Female Poverty |
| Immigrants | Pakistan | 100.0 /100 | #27 | Exceptional 18.4% |
| Immigrants | Moldova | 100.0 /100 | #28 | Exceptional 18.5% |
| Immigrants | Poland | 100.0 /100 | #29 | Exceptional 18.5% |
| Immigrants | North Macedonia | 99.9 /100 | #30 | Exceptional 18.5% |
| Immigrants | Asia | 99.9 /100 | #31 | Exceptional 18.6% |
| Immigrants | Sri Lanka | 99.9 /100 | #32 | Exceptional 18.6% |
| Immigrants | Philippines | 99.9 /100 | #33 | Exceptional 18.6% |
| Koreans | 99.9 /100 | #34 | Exceptional 18.6% |
| Immigrants | Japan | 99.9 /100 | #35 | Exceptional 18.6% |
| Turks | 99.9 /100 | #36 | Exceptional 18.7% |
| Immigrants | Armenia | 99.9 /100 | #37 | Exceptional 18.7% |
| Tongans | 99.9 /100 | #38 | Exceptional 18.8% |
| Bulgarians | 99.9 /100 | #39 | Exceptional 18.8% |
| Okinawans | 99.9 /100 | #40 | Exceptional 18.8% |
| Immigrants | Serbia | 99.9 /100 | #41 | Exceptional 18.8% |