American vs Korean Single Female Poverty
COMPARE
American
Korean
Single Female Poverty
Single Female Poverty Comparison
Americans
Koreans
24.5%
SINGLE FEMALE POVERTY
0.0/ 100
METRIC RATING
293rd/ 347
METRIC RANK
18.6%
SINGLE FEMALE POVERTY
99.9/ 100
METRIC RATING
34th/ 347
METRIC RANK
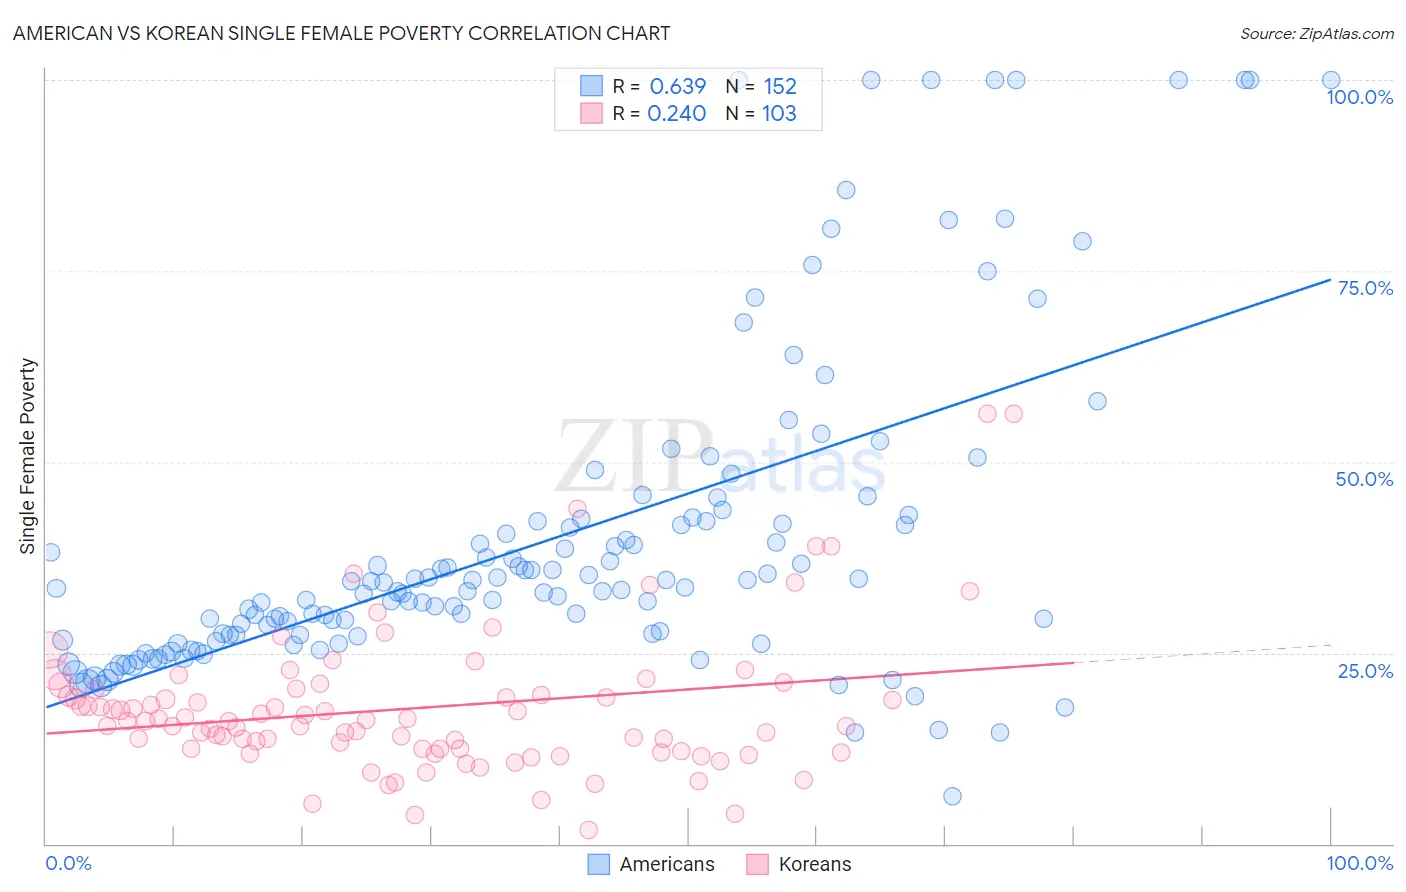
American vs Korean Single Female Poverty Correlation Chart
The statistical analysis conducted on geographies consisting of 559,828,526 people shows a significant positive correlation between the proportion of Americans and poverty level among single females in the United States with a correlation coefficient (R) of 0.639 and weighted average of 24.5%. Similarly, the statistical analysis conducted on geographies consisting of 499,036,365 people shows a weak positive correlation between the proportion of Koreans and poverty level among single females in the United States with a correlation coefficient (R) of 0.240 and weighted average of 18.6%, a difference of 31.7%.
Single Female Poverty Correlation Summary
| Measurement | American | Korean |
| Minimum | 6.2% | 1.8% |
| Maximum | 100.0% | 56.2% |
| Range | 93.8% | 54.5% |
| Mean | 39.7% | 17.8% |
| Median | 33.3% | 16.1% |
| Interquartile 25% (IQ1) | 27.3% | 12.4% |
| Interquartile 75% (IQ3) | 42.3% | 20.2% |
| Interquartile Range (IQR) | 15.0% | 7.8% |
| Standard Deviation (Sample) | 20.8% | 9.3% |
| Standard Deviation (Population) | 20.7% | 9.3% |
Similar Demographics by Single Female Poverty
Demographics Similar to Americans by Single Female Poverty
In terms of single female poverty, the demographic groups most similar to Americans are Alsatian (24.5%, a difference of 0.080%), French American Indian (24.6%, a difference of 0.15%), Osage (24.4%, a difference of 0.44%), Hispanic or Latino (24.6%, a difference of 0.49%), and African (24.8%, a difference of 0.98%).
| Demographics | Rating | Rank | Single Female Poverty |
| Cree | 0.0 /100 | #286 | Tragic 24.1% |
| Bangladeshis | 0.0 /100 | #287 | Tragic 24.2% |
| Spanish Americans | 0.0 /100 | #288 | Tragic 24.2% |
| U.S. Virgin Islanders | 0.0 /100 | #289 | Tragic 24.2% |
| Indonesians | 0.0 /100 | #290 | Tragic 24.3% |
| Osage | 0.0 /100 | #291 | Tragic 24.4% |
| Alsatians | 0.0 /100 | #292 | Tragic 24.5% |
| Americans | 0.0 /100 | #293 | Tragic 24.5% |
| French American Indians | 0.0 /100 | #294 | Tragic 24.6% |
| Hispanics or Latinos | 0.0 /100 | #295 | Tragic 24.6% |
| Africans | 0.0 /100 | #296 | Tragic 24.8% |
| Immigrants | Central America | 0.0 /100 | #297 | Tragic 24.8% |
| Yaqui | 0.0 /100 | #298 | Tragic 24.9% |
| Mexicans | 0.0 /100 | #299 | Tragic 25.0% |
| Blackfeet | 0.0 /100 | #300 | Tragic 25.1% |
Demographics Similar to Koreans by Single Female Poverty
In terms of single female poverty, the demographic groups most similar to Koreans are Immigrants from Japan (18.6%, a difference of 0.060%), Immigrants from Philippines (18.6%, a difference of 0.18%), Turkish (18.7%, a difference of 0.24%), Immigrants from Sri Lanka (18.6%, a difference of 0.25%), and Immigrants from Armenia (18.7%, a difference of 0.26%).
| Demographics | Rating | Rank | Single Female Poverty |
| Immigrants | Pakistan | 100.0 /100 | #27 | Exceptional 18.4% |
| Immigrants | Moldova | 100.0 /100 | #28 | Exceptional 18.5% |
| Immigrants | Poland | 100.0 /100 | #29 | Exceptional 18.5% |
| Immigrants | North Macedonia | 99.9 /100 | #30 | Exceptional 18.5% |
| Immigrants | Asia | 99.9 /100 | #31 | Exceptional 18.6% |
| Immigrants | Sri Lanka | 99.9 /100 | #32 | Exceptional 18.6% |
| Immigrants | Philippines | 99.9 /100 | #33 | Exceptional 18.6% |
| Koreans | 99.9 /100 | #34 | Exceptional 18.6% |
| Immigrants | Japan | 99.9 /100 | #35 | Exceptional 18.6% |
| Turks | 99.9 /100 | #36 | Exceptional 18.7% |
| Immigrants | Armenia | 99.9 /100 | #37 | Exceptional 18.7% |
| Tongans | 99.9 /100 | #38 | Exceptional 18.8% |
| Bulgarians | 99.9 /100 | #39 | Exceptional 18.8% |
| Okinawans | 99.9 /100 | #40 | Exceptional 18.8% |
| Immigrants | Serbia | 99.9 /100 | #41 | Exceptional 18.8% |