Choctaw vs Korean Single Female Poverty
COMPARE
Choctaw
Korean
Single Female Poverty
Single Female Poverty Comparison
Choctaw
Koreans
27.2%
SINGLE FEMALE POVERTY
0.0/ 100
METRIC RATING
325th/ 347
METRIC RANK
18.6%
SINGLE FEMALE POVERTY
99.9/ 100
METRIC RATING
34th/ 347
METRIC RANK
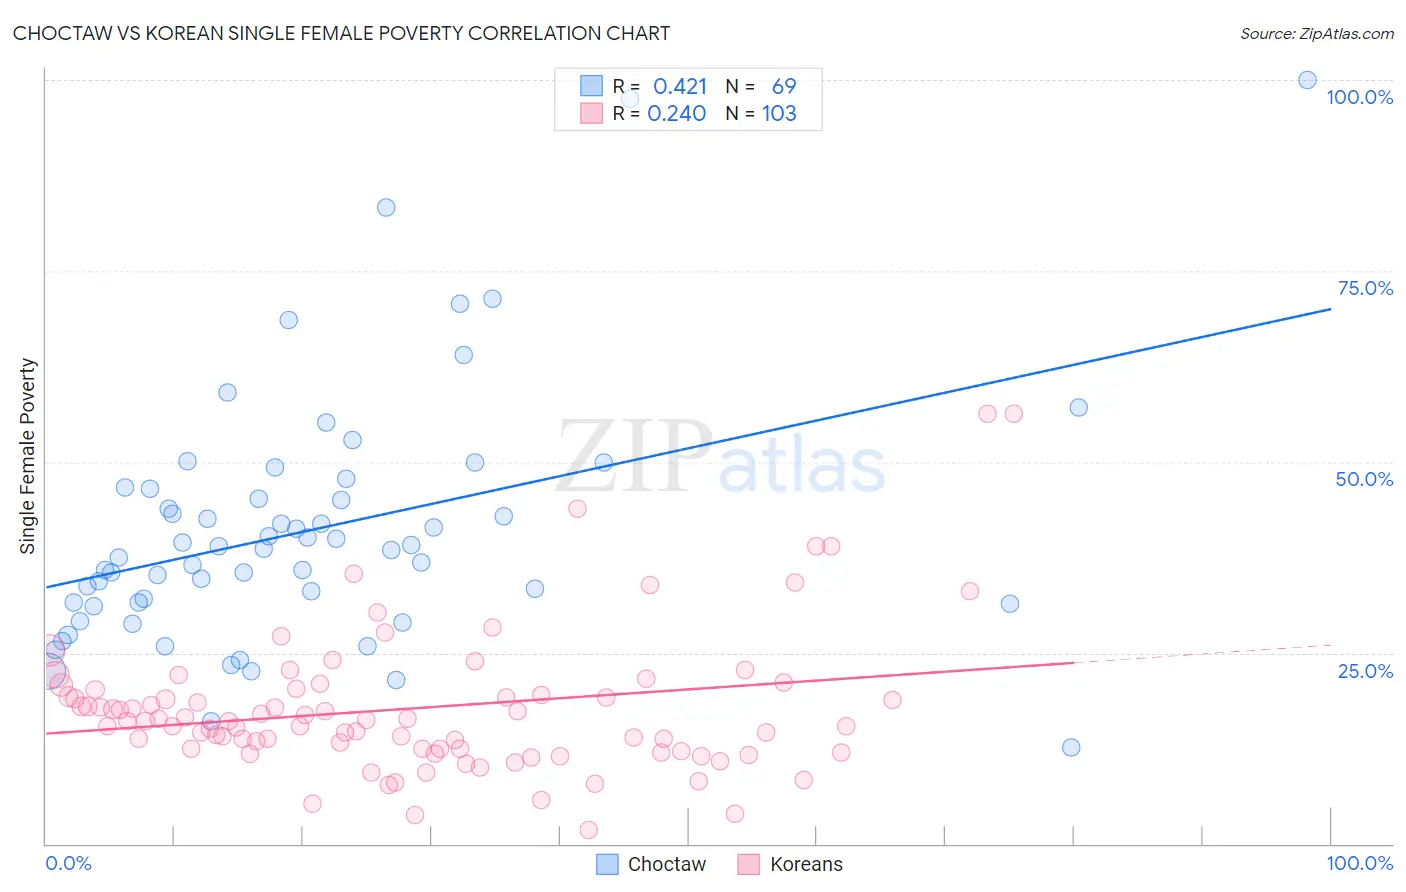
Choctaw vs Korean Single Female Poverty Correlation Chart
The statistical analysis conducted on geographies consisting of 267,534,581 people shows a moderate positive correlation between the proportion of Choctaw and poverty level among single females in the United States with a correlation coefficient (R) of 0.421 and weighted average of 27.2%. Similarly, the statistical analysis conducted on geographies consisting of 499,036,365 people shows a weak positive correlation between the proportion of Koreans and poverty level among single females in the United States with a correlation coefficient (R) of 0.240 and weighted average of 18.6%, a difference of 46.1%.
Single Female Poverty Correlation Summary
| Measurement | Choctaw | Korean |
| Minimum | 12.6% | 1.8% |
| Maximum | 100.0% | 56.2% |
| Range | 87.4% | 54.5% |
| Mean | 41.2% | 17.8% |
| Median | 38.6% | 16.1% |
| Interquartile 25% (IQ1) | 31.5% | 12.4% |
| Interquartile 75% (IQ3) | 46.6% | 20.2% |
| Interquartile Range (IQR) | 15.1% | 7.8% |
| Standard Deviation (Sample) | 16.5% | 9.3% |
| Standard Deviation (Population) | 16.4% | 9.3% |
Similar Demographics by Single Female Poverty
Demographics Similar to Choctaw by Single Female Poverty
In terms of single female poverty, the demographic groups most similar to Choctaw are Creek (27.4%, a difference of 0.88%), Dutch West Indian (27.5%, a difference of 0.96%), Kiowa (26.9%, a difference of 0.98%), Chippewa (26.8%, a difference of 1.4%), and Seminole (26.8%, a difference of 1.5%).
| Demographics | Rating | Rank | Single Female Poverty |
| Chickasaw | 0.0 /100 | #318 | Tragic 26.3% |
| Blacks/African Americans | 0.0 /100 | #319 | Tragic 26.4% |
| Arapaho | 0.0 /100 | #320 | Tragic 26.4% |
| Yup'ik | 0.0 /100 | #321 | Tragic 26.6% |
| Seminole | 0.0 /100 | #322 | Tragic 26.8% |
| Chippewa | 0.0 /100 | #323 | Tragic 26.8% |
| Kiowa | 0.0 /100 | #324 | Tragic 26.9% |
| Choctaw | 0.0 /100 | #325 | Tragic 27.2% |
| Creek | 0.0 /100 | #326 | Tragic 27.4% |
| Dutch West Indians | 0.0 /100 | #327 | Tragic 27.5% |
| Apache | 0.0 /100 | #328 | Tragic 27.7% |
| Menominee | 0.0 /100 | #329 | Tragic 27.8% |
| Hopi | 0.0 /100 | #330 | Tragic 28.0% |
| Natives/Alaskans | 0.0 /100 | #331 | Tragic 28.2% |
| Yakama | 0.0 /100 | #332 | Tragic 28.3% |
Demographics Similar to Koreans by Single Female Poverty
In terms of single female poverty, the demographic groups most similar to Koreans are Immigrants from Japan (18.6%, a difference of 0.060%), Immigrants from Philippines (18.6%, a difference of 0.18%), Turkish (18.7%, a difference of 0.24%), Immigrants from Sri Lanka (18.6%, a difference of 0.25%), and Immigrants from Armenia (18.7%, a difference of 0.26%).
| Demographics | Rating | Rank | Single Female Poverty |
| Immigrants | Pakistan | 100.0 /100 | #27 | Exceptional 18.4% |
| Immigrants | Moldova | 100.0 /100 | #28 | Exceptional 18.5% |
| Immigrants | Poland | 100.0 /100 | #29 | Exceptional 18.5% |
| Immigrants | North Macedonia | 99.9 /100 | #30 | Exceptional 18.5% |
| Immigrants | Asia | 99.9 /100 | #31 | Exceptional 18.6% |
| Immigrants | Sri Lanka | 99.9 /100 | #32 | Exceptional 18.6% |
| Immigrants | Philippines | 99.9 /100 | #33 | Exceptional 18.6% |
| Koreans | 99.9 /100 | #34 | Exceptional 18.6% |
| Immigrants | Japan | 99.9 /100 | #35 | Exceptional 18.6% |
| Turks | 99.9 /100 | #36 | Exceptional 18.7% |
| Immigrants | Armenia | 99.9 /100 | #37 | Exceptional 18.7% |
| Tongans | 99.9 /100 | #38 | Exceptional 18.8% |
| Bulgarians | 99.9 /100 | #39 | Exceptional 18.8% |
| Okinawans | 99.9 /100 | #40 | Exceptional 18.8% |
| Immigrants | Serbia | 99.9 /100 | #41 | Exceptional 18.8% |