Iroquois vs Choctaw Female Poverty
COMPARE
Iroquois
Choctaw
Female Poverty
Female Poverty Comparison
Iroquois
Choctaw
15.8%
FEMALE POVERTY
0.1/ 100
METRIC RATING
269th/ 347
METRIC RANK
16.8%
FEMALE POVERTY
0.0/ 100
METRIC RATING
303rd/ 347
METRIC RANK
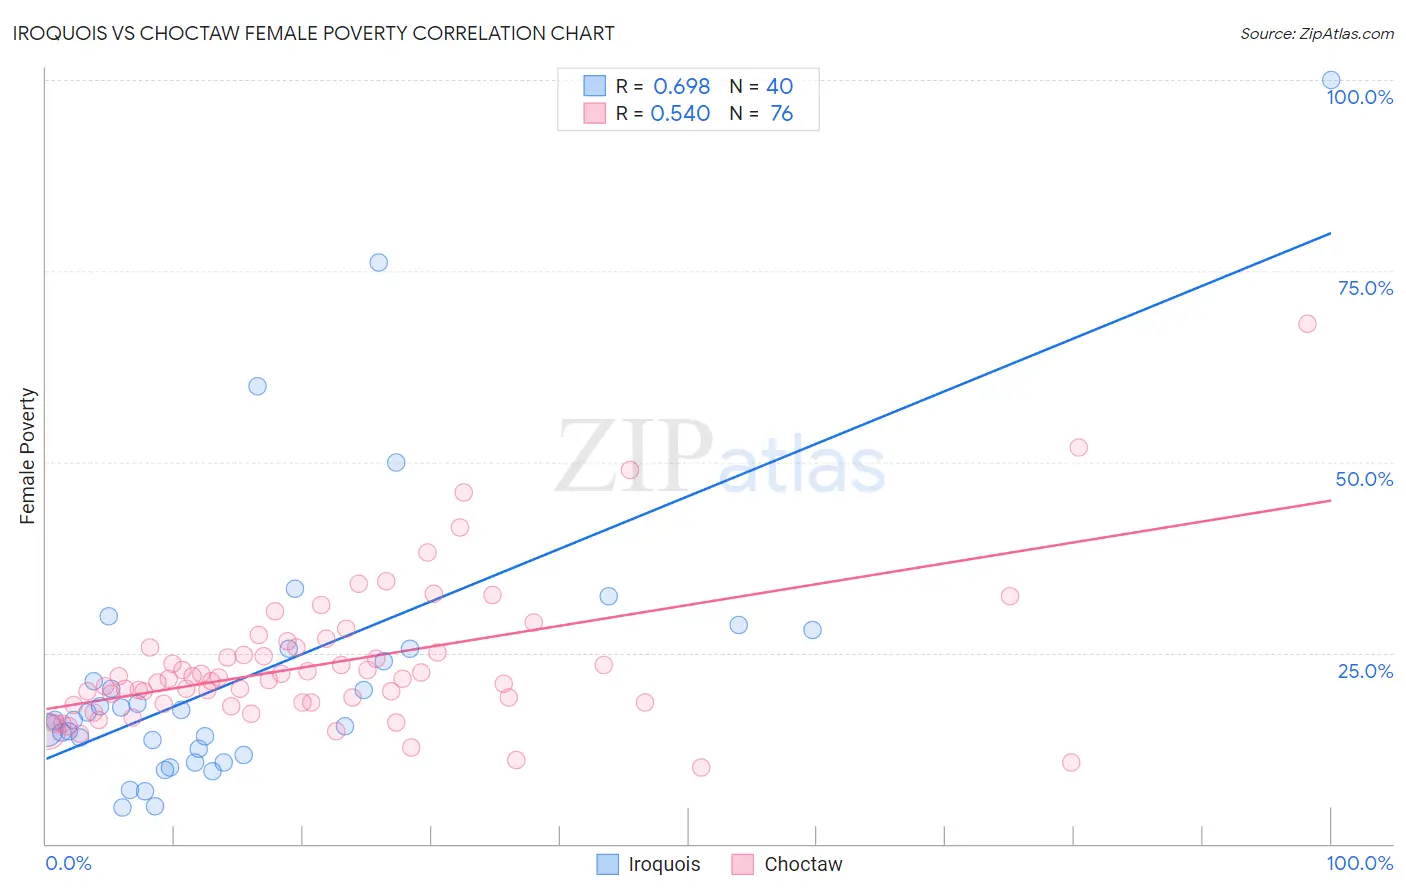
Iroquois vs Choctaw Female Poverty Correlation Chart
The statistical analysis conducted on geographies consisting of 207,228,109 people shows a significant positive correlation between the proportion of Iroquois and poverty level among females in the United States with a correlation coefficient (R) of 0.698 and weighted average of 15.8%. Similarly, the statistical analysis conducted on geographies consisting of 269,592,766 people shows a substantial positive correlation between the proportion of Choctaw and poverty level among females in the United States with a correlation coefficient (R) of 0.540 and weighted average of 16.8%, a difference of 6.2%.
Female Poverty Correlation Summary
| Measurement | Iroquois | Choctaw |
| Minimum | 4.7% | 10.0% |
| Maximum | 100.0% | 68.1% |
| Range | 95.3% | 58.1% |
| Mean | 22.4% | 23.7% |
| Median | 16.7% | 21.6% |
| Interquartile 25% (IQ1) | 12.0% | 18.4% |
| Interquartile 75% (IQ3) | 25.5% | 25.6% |
| Interquartile Range (IQR) | 13.5% | 7.2% |
| Standard Deviation (Sample) | 19.0% | 9.5% |
| Standard Deviation (Population) | 18.8% | 9.5% |
Similar Demographics by Female Poverty
Demographics Similar to Iroquois by Female Poverty
In terms of female poverty, the demographic groups most similar to Iroquois are Chickasaw (15.9%, a difference of 0.26%), Immigrants from Nicaragua (15.8%, a difference of 0.37%), Subsaharan African (15.8%, a difference of 0.43%), Immigrants from St. Vincent and the Grenadines (15.9%, a difference of 0.54%), and Belizean (15.9%, a difference of 0.76%).
| Demographics | Rating | Rank | Female Poverty |
| Mexican American Indians | 0.1 /100 | #262 | Tragic 15.6% |
| Cherokee | 0.1 /100 | #263 | Tragic 15.6% |
| Immigrants | Ecuador | 0.1 /100 | #264 | Tragic 15.6% |
| Immigrants | Liberia | 0.1 /100 | #265 | Tragic 15.7% |
| Immigrants | El Salvador | 0.1 /100 | #266 | Tragic 15.7% |
| Sub-Saharan Africans | 0.1 /100 | #267 | Tragic 15.8% |
| Immigrants | Nicaragua | 0.1 /100 | #268 | Tragic 15.8% |
| Iroquois | 0.1 /100 | #269 | Tragic 15.8% |
| Chickasaw | 0.1 /100 | #270 | Tragic 15.9% |
| Immigrants | St. Vincent and the Grenadines | 0.0 /100 | #271 | Tragic 15.9% |
| Belizeans | 0.0 /100 | #272 | Tragic 15.9% |
| Haitians | 0.0 /100 | #273 | Tragic 15.9% |
| Barbadians | 0.0 /100 | #274 | Tragic 15.9% |
| Immigrants | Barbados | 0.0 /100 | #275 | Tragic 16.0% |
| Central Americans | 0.0 /100 | #276 | Tragic 16.0% |
Demographics Similar to Choctaw by Female Poverty
In terms of female poverty, the demographic groups most similar to Choctaw are Immigrants from Central America (16.8%, a difference of 0.060%), Immigrants from Grenada (16.8%, a difference of 0.070%), Immigrants from Caribbean (16.9%, a difference of 0.33%), Seminole (16.9%, a difference of 0.46%), and African (16.9%, a difference of 0.52%).
| Demographics | Rating | Rank | Female Poverty |
| Immigrants | Senegal | 0.0 /100 | #296 | Tragic 16.5% |
| Mexicans | 0.0 /100 | #297 | Tragic 16.5% |
| Somalis | 0.0 /100 | #298 | Tragic 16.6% |
| Hispanics or Latinos | 0.0 /100 | #299 | Tragic 16.6% |
| Bahamians | 0.0 /100 | #300 | Tragic 16.6% |
| Guatemalans | 0.0 /100 | #301 | Tragic 16.7% |
| Chippewa | 0.0 /100 | #302 | Tragic 16.7% |
| Choctaw | 0.0 /100 | #303 | Tragic 16.8% |
| Immigrants | Central America | 0.0 /100 | #304 | Tragic 16.8% |
| Immigrants | Grenada | 0.0 /100 | #305 | Tragic 16.8% |
| Immigrants | Caribbean | 0.0 /100 | #306 | Tragic 16.9% |
| Seminole | 0.0 /100 | #307 | Tragic 16.9% |
| Africans | 0.0 /100 | #308 | Tragic 16.9% |
| Immigrants | Mexico | 0.0 /100 | #309 | Tragic 17.0% |
| Creek | 0.0 /100 | #310 | Tragic 17.0% |