Irish vs Liberian Single Female Poverty
COMPARE
Irish
Liberian
Single Female Poverty
Single Female Poverty Comparison
Irish
Liberians
21.4%
SINGLE FEMALE POVERTY
21.4/ 100
METRIC RATING
200th/ 347
METRIC RANK
22.4%
SINGLE FEMALE POVERTY
1.4/ 100
METRIC RATING
246th/ 347
METRIC RANK
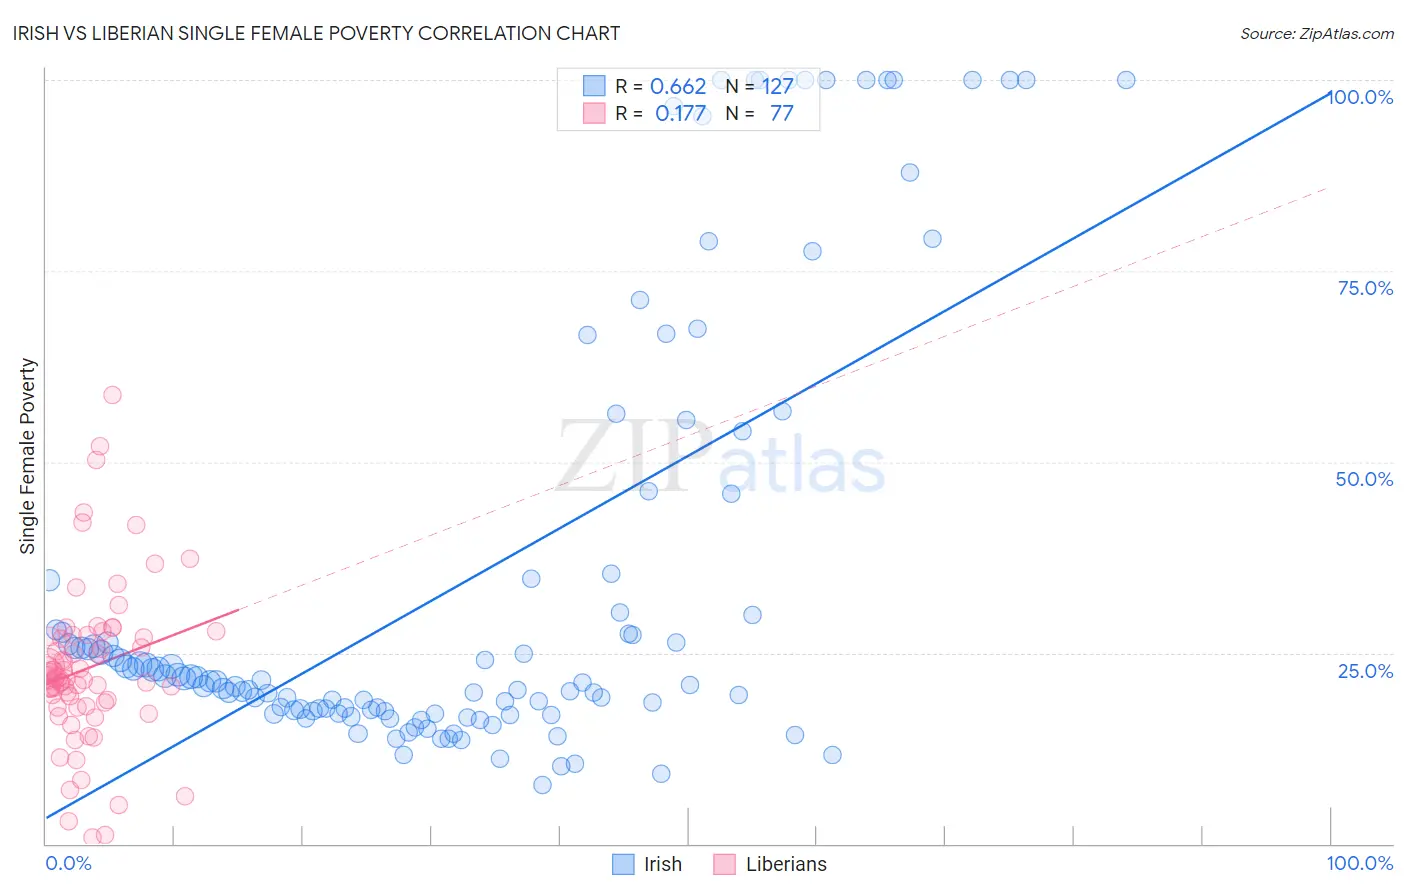
Irish vs Liberian Single Female Poverty Correlation Chart
The statistical analysis conducted on geographies consisting of 557,675,928 people shows a significant positive correlation between the proportion of Irish and poverty level among single females in the United States with a correlation coefficient (R) of 0.662 and weighted average of 21.4%. Similarly, the statistical analysis conducted on geographies consisting of 117,657,601 people shows a poor positive correlation between the proportion of Liberians and poverty level among single females in the United States with a correlation coefficient (R) of 0.177 and weighted average of 22.4%, a difference of 4.5%.
Single Female Poverty Correlation Summary
| Measurement | Irish | Liberian |
| Minimum | 7.7% | 0.74% |
| Maximum | 100.0% | 58.7% |
| Range | 92.3% | 58.0% |
| Mean | 34.3% | 23.0% |
| Median | 21.2% | 21.7% |
| Interquartile 25% (IQ1) | 17.4% | 18.3% |
| Interquartile 75% (IQ3) | 34.5% | 27.2% |
| Interquartile Range (IQR) | 17.1% | 9.0% |
| Standard Deviation (Sample) | 28.5% | 10.5% |
| Standard Deviation (Population) | 28.4% | 10.4% |
Similar Demographics by Single Female Poverty
Demographics Similar to Irish by Single Female Poverty
In terms of single female poverty, the demographic groups most similar to Irish are Nigerian (21.4%, a difference of 0.040%), Immigrants (21.4%, a difference of 0.050%), Immigrants from Kenya (21.4%, a difference of 0.070%), Swiss (21.4%, a difference of 0.25%), and Immigrants from Haiti (21.5%, a difference of 0.25%).
| Demographics | Rating | Rank | Single Female Poverty |
| Basques | 28.1 /100 | #193 | Fair 21.3% |
| Czechoslovakians | 27.7 /100 | #194 | Fair 21.3% |
| Nicaraguans | 27.6 /100 | #195 | Fair 21.3% |
| Immigrants | Saudi Arabia | 27.1 /100 | #196 | Fair 21.3% |
| Japanese | 26.4 /100 | #197 | Fair 21.3% |
| Swiss | 24.2 /100 | #198 | Fair 21.4% |
| Immigrants | Immigrants | 22.0 /100 | #199 | Fair 21.4% |
| Irish | 21.4 /100 | #200 | Fair 21.4% |
| Nigerians | 20.9 /100 | #201 | Fair 21.4% |
| Immigrants | Kenya | 20.7 /100 | #202 | Fair 21.4% |
| Immigrants | Haiti | 18.8 /100 | #203 | Poor 21.5% |
| Immigrants | Africa | 16.7 /100 | #204 | Poor 21.5% |
| Finns | 16.2 /100 | #205 | Poor 21.5% |
| Belgians | 16.1 /100 | #206 | Poor 21.5% |
| Ghanaians | 15.7 /100 | #207 | Poor 21.6% |
Demographics Similar to Liberians by Single Female Poverty
In terms of single female poverty, the demographic groups most similar to Liberians are Immigrants from El Salvador (22.4%, a difference of 0.060%), Belizean (22.4%, a difference of 0.070%), Immigrants from Caribbean (22.4%, a difference of 0.17%), Immigrants from Bahamas (22.5%, a difference of 0.32%), and Immigrants from Bangladesh (22.3%, a difference of 0.37%).
| Demographics | Rating | Rank | Single Female Poverty |
| Malaysians | 2.8 /100 | #239 | Tragic 22.2% |
| French | 2.3 /100 | #240 | Tragic 22.2% |
| Cape Verdeans | 2.1 /100 | #241 | Tragic 22.3% |
| Bermudans | 2.0 /100 | #242 | Tragic 22.3% |
| West Indians | 1.9 /100 | #243 | Tragic 22.3% |
| Immigrants | Middle Africa | 1.9 /100 | #244 | Tragic 22.3% |
| Immigrants | Bangladesh | 1.8 /100 | #245 | Tragic 22.3% |
| Liberians | 1.4 /100 | #246 | Tragic 22.4% |
| Immigrants | El Salvador | 1.4 /100 | #247 | Tragic 22.4% |
| Belizeans | 1.4 /100 | #248 | Tragic 22.4% |
| Immigrants | Caribbean | 1.3 /100 | #249 | Tragic 22.4% |
| Immigrants | Bahamas | 1.2 /100 | #250 | Tragic 22.5% |
| Immigrants | West Indies | 1.0 /100 | #251 | Tragic 22.5% |
| Delaware | 1.0 /100 | #252 | Tragic 22.5% |
| Immigrants | Liberia | 0.9 /100 | #253 | Tragic 22.5% |