Fijian vs Liberian Single Female Poverty
COMPARE
Fijian
Liberian
Single Female Poverty
Single Female Poverty Comparison
Fijians
Liberians
23.1%
SINGLE FEMALE POVERTY
0.2/ 100
METRIC RATING
268th/ 347
METRIC RANK
22.4%
SINGLE FEMALE POVERTY
1.4/ 100
METRIC RATING
246th/ 347
METRIC RANK
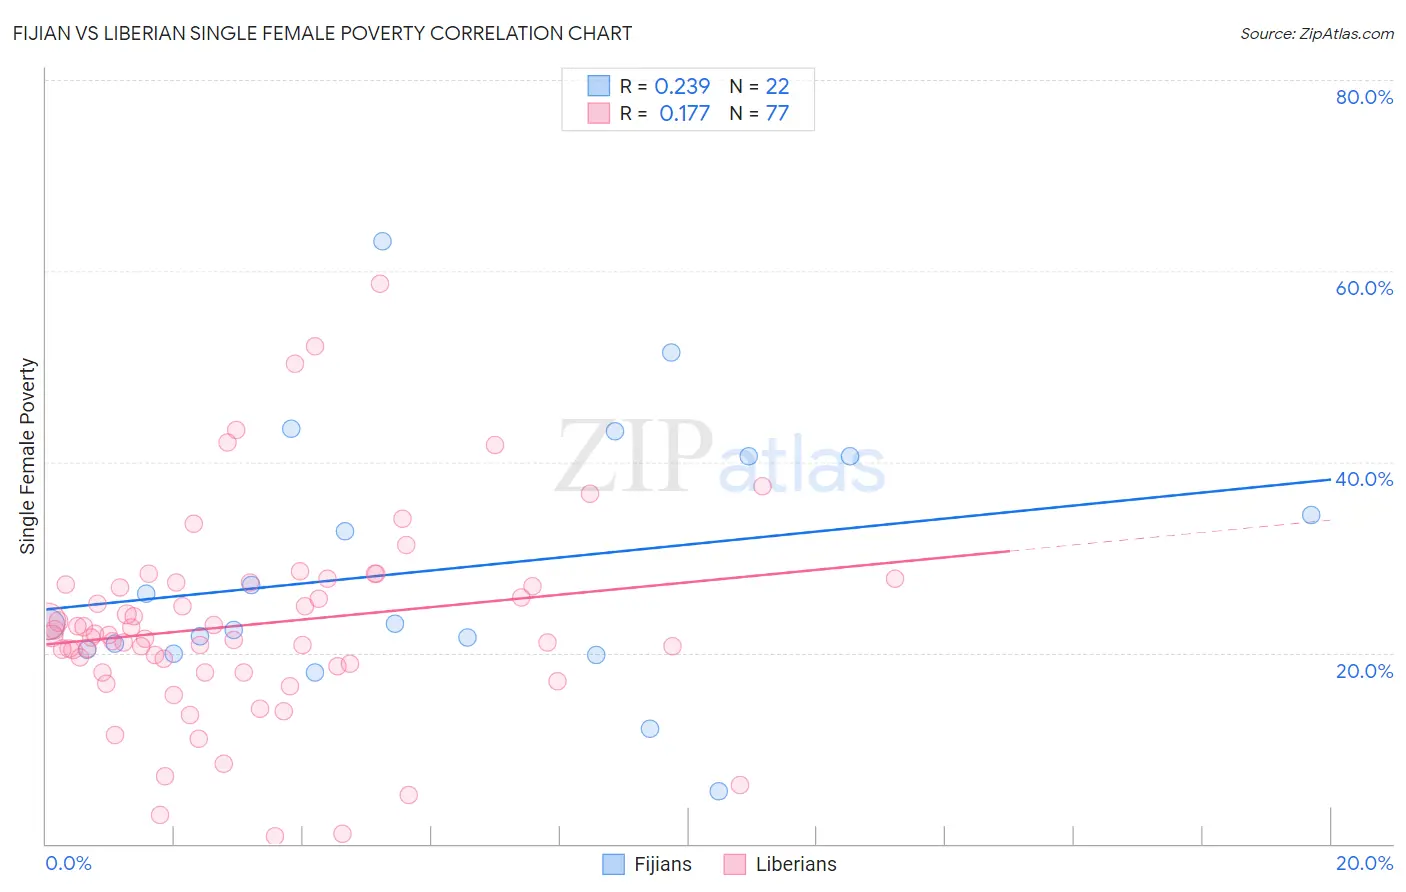
Fijian vs Liberian Single Female Poverty Correlation Chart
The statistical analysis conducted on geographies consisting of 55,892,814 people shows a weak positive correlation between the proportion of Fijians and poverty level among single females in the United States with a correlation coefficient (R) of 0.239 and weighted average of 23.1%. Similarly, the statistical analysis conducted on geographies consisting of 117,657,601 people shows a poor positive correlation between the proportion of Liberians and poverty level among single females in the United States with a correlation coefficient (R) of 0.177 and weighted average of 22.4%, a difference of 3.0%.
Single Female Poverty Correlation Summary
| Measurement | Fijian | Liberian |
| Minimum | 5.6% | 0.74% |
| Maximum | 63.2% | 58.7% |
| Range | 57.6% | 58.0% |
| Mean | 28.7% | 23.0% |
| Median | 23.0% | 21.7% |
| Interquartile 25% (IQ1) | 20.3% | 18.3% |
| Interquartile 75% (IQ3) | 40.6% | 27.2% |
| Interquartile Range (IQR) | 20.3% | 9.0% |
| Standard Deviation (Sample) | 13.6% | 10.5% |
| Standard Deviation (Population) | 13.3% | 10.4% |
Similar Demographics by Single Female Poverty
Demographics Similar to Fijians by Single Female Poverty
In terms of single female poverty, the demographic groups most similar to Fijians are Hmong (23.1%, a difference of 0.030%), Senegalese (23.0%, a difference of 0.070%), Immigrants from Micronesia (23.0%, a difference of 0.13%), Inupiat (23.1%, a difference of 0.28%), and Central American (23.0%, a difference of 0.34%).
| Demographics | Rating | Rank | Single Female Poverty |
| Immigrants | Cabo Verde | 0.4 /100 | #261 | Tragic 22.8% |
| British West Indians | 0.4 /100 | #262 | Tragic 22.8% |
| Scotch-Irish | 0.3 /100 | #263 | Tragic 22.9% |
| Immigrants | Laos | 0.3 /100 | #264 | Tragic 22.9% |
| Central Americans | 0.2 /100 | #265 | Tragic 23.0% |
| Immigrants | Micronesia | 0.2 /100 | #266 | Tragic 23.0% |
| Senegalese | 0.2 /100 | #267 | Tragic 23.0% |
| Fijians | 0.2 /100 | #268 | Tragic 23.1% |
| Hmong | 0.2 /100 | #269 | Tragic 23.1% |
| Inupiat | 0.2 /100 | #270 | Tragic 23.1% |
| Sub-Saharan Africans | 0.1 /100 | #271 | Tragic 23.2% |
| Immigrants | Senegal | 0.1 /100 | #272 | Tragic 23.2% |
| Alaska Natives | 0.1 /100 | #273 | Tragic 23.3% |
| Marshallese | 0.1 /100 | #274 | Tragic 23.3% |
| Mexican American Indians | 0.1 /100 | #275 | Tragic 23.4% |
Demographics Similar to Liberians by Single Female Poverty
In terms of single female poverty, the demographic groups most similar to Liberians are Immigrants from El Salvador (22.4%, a difference of 0.060%), Belizean (22.4%, a difference of 0.070%), Immigrants from Caribbean (22.4%, a difference of 0.17%), Immigrants from Bahamas (22.5%, a difference of 0.32%), and Immigrants from Bangladesh (22.3%, a difference of 0.37%).
| Demographics | Rating | Rank | Single Female Poverty |
| Malaysians | 2.8 /100 | #239 | Tragic 22.2% |
| French | 2.3 /100 | #240 | Tragic 22.2% |
| Cape Verdeans | 2.1 /100 | #241 | Tragic 22.3% |
| Bermudans | 2.0 /100 | #242 | Tragic 22.3% |
| West Indians | 1.9 /100 | #243 | Tragic 22.3% |
| Immigrants | Middle Africa | 1.9 /100 | #244 | Tragic 22.3% |
| Immigrants | Bangladesh | 1.8 /100 | #245 | Tragic 22.3% |
| Liberians | 1.4 /100 | #246 | Tragic 22.4% |
| Immigrants | El Salvador | 1.4 /100 | #247 | Tragic 22.4% |
| Belizeans | 1.4 /100 | #248 | Tragic 22.4% |
| Immigrants | Caribbean | 1.3 /100 | #249 | Tragic 22.4% |
| Immigrants | Bahamas | 1.2 /100 | #250 | Tragic 22.5% |
| Immigrants | West Indies | 1.0 /100 | #251 | Tragic 22.5% |
| Delaware | 1.0 /100 | #252 | Tragic 22.5% |
| Immigrants | Liberia | 0.9 /100 | #253 | Tragic 22.5% |