Inupiat vs Immigrants from Poland Male Poverty
COMPARE
Inupiat
Immigrants from Poland
Male Poverty
Male Poverty Comparison
Inupiat
Immigrants from Poland
14.0%
MALE POVERTY
0.0/ 100
METRIC RATING
297th/ 347
METRIC RANK
9.8%
MALE POVERTY
99.5/ 100
METRIC RATING
34th/ 347
METRIC RANK
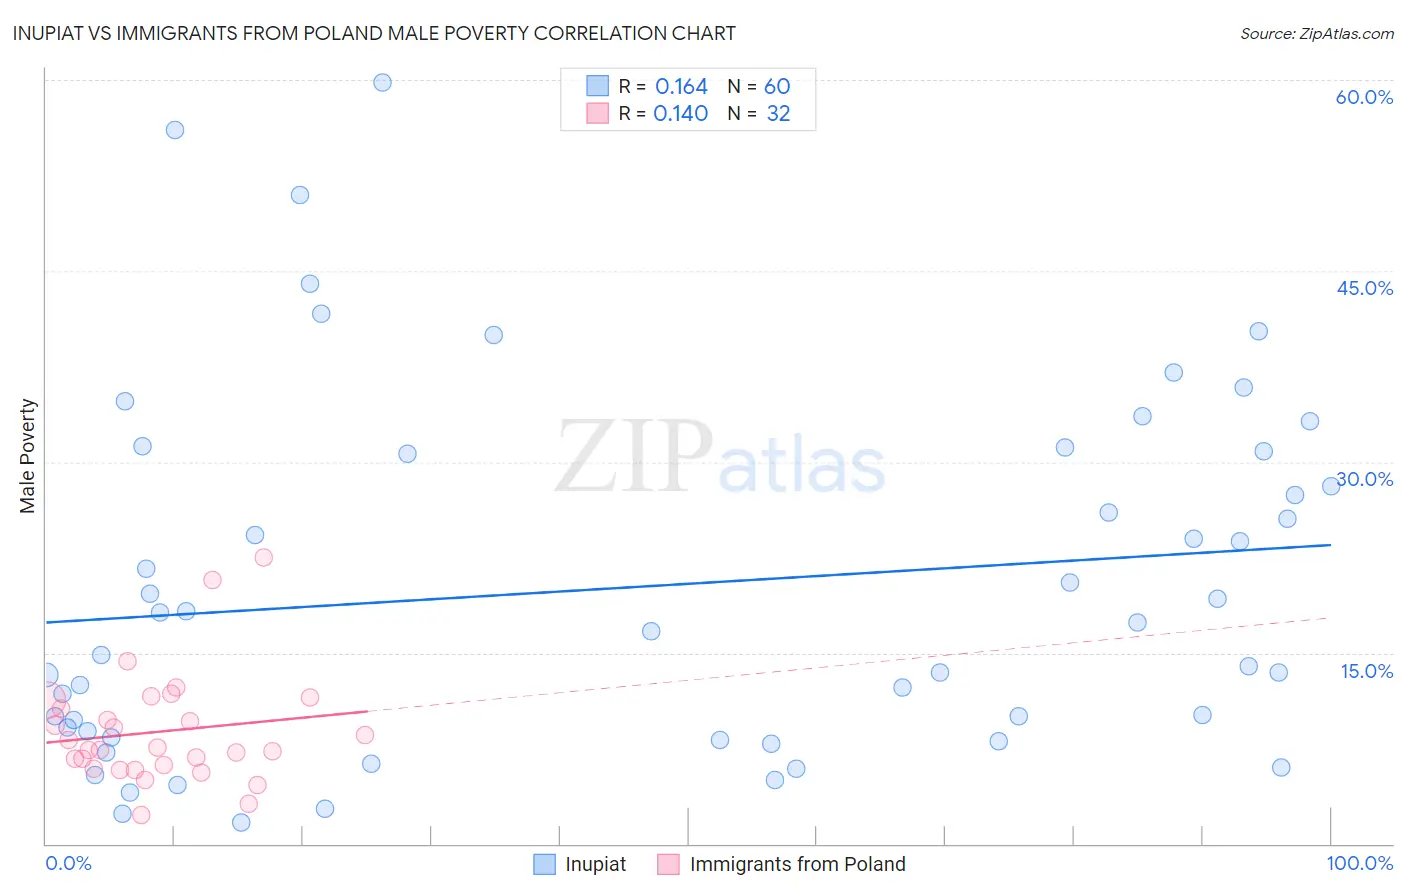
Inupiat vs Immigrants from Poland Male Poverty Correlation Chart
The statistical analysis conducted on geographies consisting of 96,314,568 people shows a poor positive correlation between the proportion of Inupiat and poverty level among males in the United States with a correlation coefficient (R) of 0.164 and weighted average of 14.0%. Similarly, the statistical analysis conducted on geographies consisting of 304,660,101 people shows a poor positive correlation between the proportion of Immigrants from Poland and poverty level among males in the United States with a correlation coefficient (R) of 0.140 and weighted average of 9.8%, a difference of 43.4%.
Male Poverty Correlation Summary
| Measurement | Inupiat | Immigrants from Poland |
| Minimum | 1.7% | 2.3% |
| Maximum | 59.8% | 22.5% |
| Range | 58.1% | 20.2% |
| Mean | 20.1% | 8.8% |
| Median | 17.0% | 7.5% |
| Interquartile 25% (IQ1) | 8.6% | 6.0% |
| Interquartile 75% (IQ3) | 30.7% | 11.0% |
| Interquartile Range (IQR) | 22.1% | 4.9% |
| Standard Deviation (Sample) | 14.1% | 4.3% |
| Standard Deviation (Population) | 14.0% | 4.3% |
Similar Demographics by Male Poverty
Demographics Similar to Inupiat by Male Poverty
In terms of male poverty, the demographic groups most similar to Inupiat are Blackfeet (14.0%, a difference of 0.030%), Immigrants from Guatemala (14.0%, a difference of 0.13%), Immigrants from Mexico (14.0%, a difference of 0.25%), Immigrants from Senegal (14.0%, a difference of 0.32%), and Immigrants from Caribbean (14.0%, a difference of 0.37%).
| Demographics | Rating | Rank | Male Poverty |
| Immigrants | Zaire | 0.0 /100 | #290 | Tragic 13.8% |
| Vietnamese | 0.0 /100 | #291 | Tragic 13.8% |
| Indonesians | 0.0 /100 | #292 | Tragic 13.8% |
| Immigrants | Belize | 0.0 /100 | #293 | Tragic 13.8% |
| Hispanics or Latinos | 0.0 /100 | #294 | Tragic 13.9% |
| Immigrants | Central America | 0.0 /100 | #295 | Tragic 13.9% |
| Cajuns | 0.0 /100 | #296 | Tragic 13.9% |
| Inupiat | 0.0 /100 | #297 | Tragic 14.0% |
| Blackfeet | 0.0 /100 | #298 | Tragic 14.0% |
| Immigrants | Guatemala | 0.0 /100 | #299 | Tragic 14.0% |
| Immigrants | Mexico | 0.0 /100 | #300 | Tragic 14.0% |
| Immigrants | Senegal | 0.0 /100 | #301 | Tragic 14.0% |
| Immigrants | Caribbean | 0.0 /100 | #302 | Tragic 14.0% |
| Bahamians | 0.0 /100 | #303 | Tragic 14.1% |
| Senegalese | 0.0 /100 | #304 | Tragic 14.1% |
Demographics Similar to Immigrants from Poland by Male Poverty
In terms of male poverty, the demographic groups most similar to Immigrants from Poland are Immigrants from Northern Europe (9.7%, a difference of 0.15%), Macedonian (9.7%, a difference of 0.23%), Iranian (9.8%, a difference of 0.30%), Czech (9.8%, a difference of 0.39%), and Tongan (9.7%, a difference of 0.44%).
| Demographics | Rating | Rank | Male Poverty |
| Danes | 99.6 /100 | #27 | Exceptional 9.7% |
| Immigrants | Korea | 99.6 /100 | #28 | Exceptional 9.7% |
| Greeks | 99.6 /100 | #29 | Exceptional 9.7% |
| Poles | 99.5 /100 | #30 | Exceptional 9.7% |
| Tongans | 99.5 /100 | #31 | Exceptional 9.7% |
| Macedonians | 99.5 /100 | #32 | Exceptional 9.7% |
| Immigrants | Northern Europe | 99.5 /100 | #33 | Exceptional 9.7% |
| Immigrants | Poland | 99.5 /100 | #34 | Exceptional 9.8% |
| Iranians | 99.4 /100 | #35 | Exceptional 9.8% |
| Czechs | 99.4 /100 | #36 | Exceptional 9.8% |
| Immigrants | Greece | 99.3 /100 | #37 | Exceptional 9.8% |
| Immigrants | Pakistan | 99.2 /100 | #38 | Exceptional 9.9% |
| Russians | 99.2 /100 | #39 | Exceptional 9.9% |
| Cypriots | 99.2 /100 | #40 | Exceptional 9.9% |
| Koreans | 99.2 /100 | #41 | Exceptional 9.9% |