Inupiat vs Mongolian Male Poverty
COMPARE
Inupiat
Mongolian
Male Poverty
Male Poverty Comparison
Inupiat
Mongolians
14.0%
MALE POVERTY
0.0/ 100
METRIC RATING
297th/ 347
METRIC RANK
11.3%
MALE POVERTY
39.0/ 100
METRIC RATING
182nd/ 347
METRIC RANK
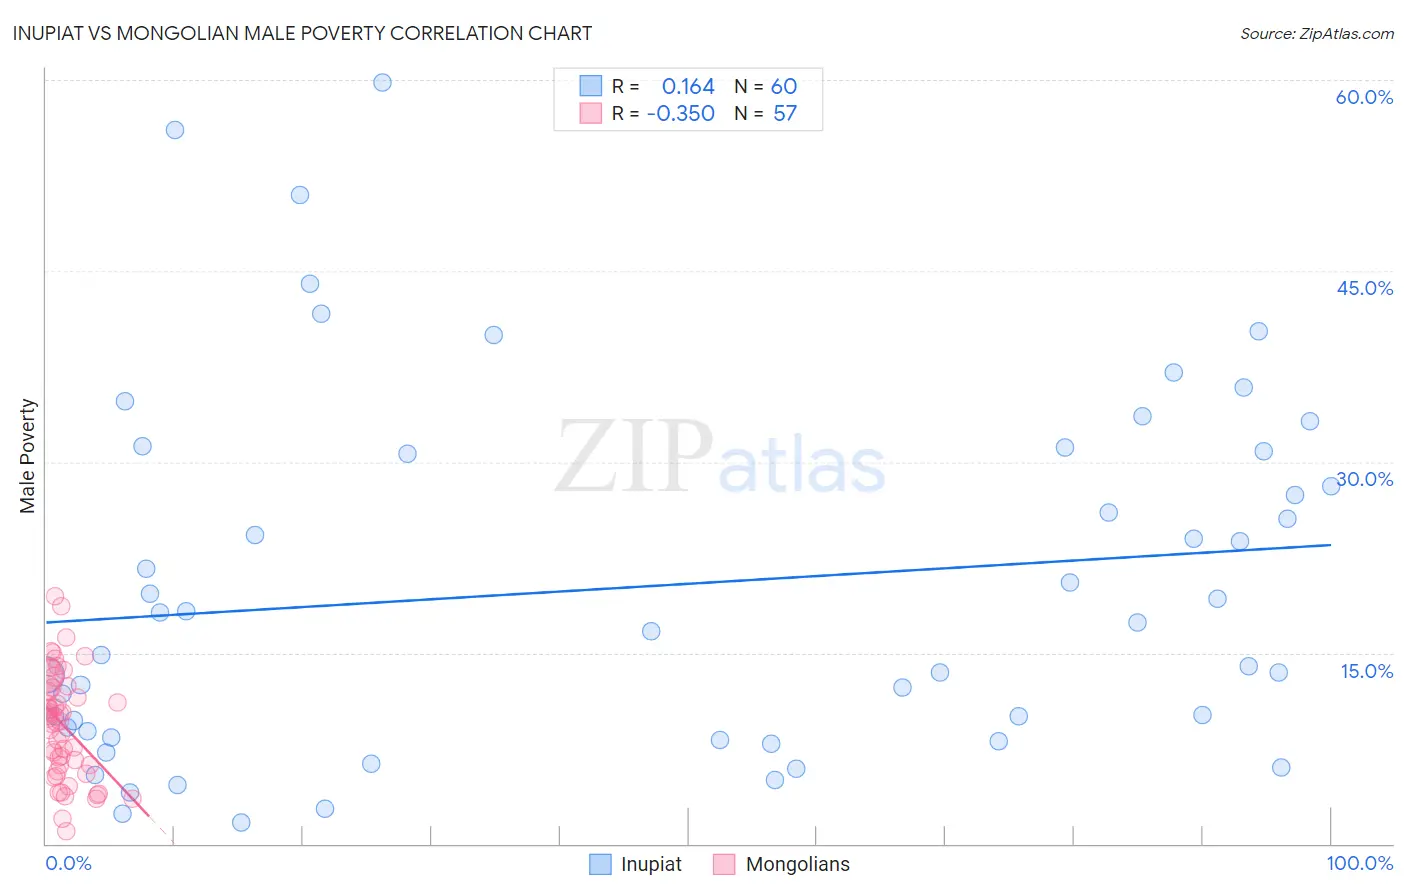
Inupiat vs Mongolian Male Poverty Correlation Chart
The statistical analysis conducted on geographies consisting of 96,314,568 people shows a poor positive correlation between the proportion of Inupiat and poverty level among males in the United States with a correlation coefficient (R) of 0.164 and weighted average of 14.0%. Similarly, the statistical analysis conducted on geographies consisting of 140,285,777 people shows a mild negative correlation between the proportion of Mongolians and poverty level among males in the United States with a correlation coefficient (R) of -0.350 and weighted average of 11.3%, a difference of 23.7%.
Male Poverty Correlation Summary
| Measurement | Inupiat | Mongolian |
| Minimum | 1.7% | 0.97% |
| Maximum | 59.8% | 19.4% |
| Range | 58.1% | 18.5% |
| Mean | 20.1% | 9.3% |
| Median | 17.0% | 9.6% |
| Interquartile 25% (IQ1) | 8.6% | 5.9% |
| Interquartile 75% (IQ3) | 30.7% | 12.3% |
| Interquartile Range (IQR) | 22.1% | 6.4% |
| Standard Deviation (Sample) | 14.1% | 4.2% |
| Standard Deviation (Population) | 14.0% | 4.2% |
Similar Demographics by Male Poverty
Demographics Similar to Inupiat by Male Poverty
In terms of male poverty, the demographic groups most similar to Inupiat are Blackfeet (14.0%, a difference of 0.030%), Immigrants from Guatemala (14.0%, a difference of 0.13%), Immigrants from Mexico (14.0%, a difference of 0.25%), Immigrants from Senegal (14.0%, a difference of 0.32%), and Immigrants from Caribbean (14.0%, a difference of 0.37%).
| Demographics | Rating | Rank | Male Poverty |
| Immigrants | Zaire | 0.0 /100 | #290 | Tragic 13.8% |
| Vietnamese | 0.0 /100 | #291 | Tragic 13.8% |
| Indonesians | 0.0 /100 | #292 | Tragic 13.8% |
| Immigrants | Belize | 0.0 /100 | #293 | Tragic 13.8% |
| Hispanics or Latinos | 0.0 /100 | #294 | Tragic 13.9% |
| Immigrants | Central America | 0.0 /100 | #295 | Tragic 13.9% |
| Cajuns | 0.0 /100 | #296 | Tragic 13.9% |
| Inupiat | 0.0 /100 | #297 | Tragic 14.0% |
| Blackfeet | 0.0 /100 | #298 | Tragic 14.0% |
| Immigrants | Guatemala | 0.0 /100 | #299 | Tragic 14.0% |
| Immigrants | Mexico | 0.0 /100 | #300 | Tragic 14.0% |
| Immigrants | Senegal | 0.0 /100 | #301 | Tragic 14.0% |
| Immigrants | Caribbean | 0.0 /100 | #302 | Tragic 14.0% |
| Bahamians | 0.0 /100 | #303 | Tragic 14.1% |
| Senegalese | 0.0 /100 | #304 | Tragic 14.1% |
Demographics Similar to Mongolians by Male Poverty
In terms of male poverty, the demographic groups most similar to Mongolians are Immigrants from Costa Rica (11.3%, a difference of 0.050%), Kenyan (11.3%, a difference of 0.060%), Immigrants from Morocco (11.3%, a difference of 0.11%), Immigrants from Syria (11.3%, a difference of 0.13%), and Immigrants from South America (11.3%, a difference of 0.22%).
| Demographics | Rating | Rank | Male Poverty |
| Celtics | 47.5 /100 | #175 | Average 11.2% |
| Immigrants | Fiji | 46.0 /100 | #176 | Average 11.2% |
| Lebanese | 45.6 /100 | #177 | Average 11.2% |
| Immigrants | Cameroon | 44.5 /100 | #178 | Average 11.2% |
| Immigrants | Syria | 40.3 /100 | #179 | Average 11.3% |
| Immigrants | Morocco | 40.1 /100 | #180 | Average 11.3% |
| Immigrants | Costa Rica | 39.5 /100 | #181 | Fair 11.3% |
| Mongolians | 39.0 /100 | #182 | Fair 11.3% |
| Kenyans | 38.4 /100 | #183 | Fair 11.3% |
| Immigrants | South America | 36.9 /100 | #184 | Fair 11.3% |
| Immigrants | Afghanistan | 33.3 /100 | #185 | Fair 11.4% |
| Immigrants | Sierra Leone | 32.9 /100 | #186 | Fair 11.4% |
| Immigrants | Iraq | 31.9 /100 | #187 | Fair 11.4% |
| Sierra Leoneans | 29.9 /100 | #188 | Fair 11.4% |
| Hawaiians | 28.3 /100 | #189 | Fair 11.4% |