Inupiat vs Immigrants from Poland Divorced or Separated
COMPARE
Inupiat
Immigrants from Poland
Divorced or Separated
Divorced or Separated Comparison
Inupiat
Immigrants from Poland
11.4%
DIVORCED OR SEPARATED
99.8/ 100
METRIC RATING
66th/ 347
METRIC RANK
11.2%
DIVORCED OR SEPARATED
100.0/ 100
METRIC RATING
47th/ 347
METRIC RANK
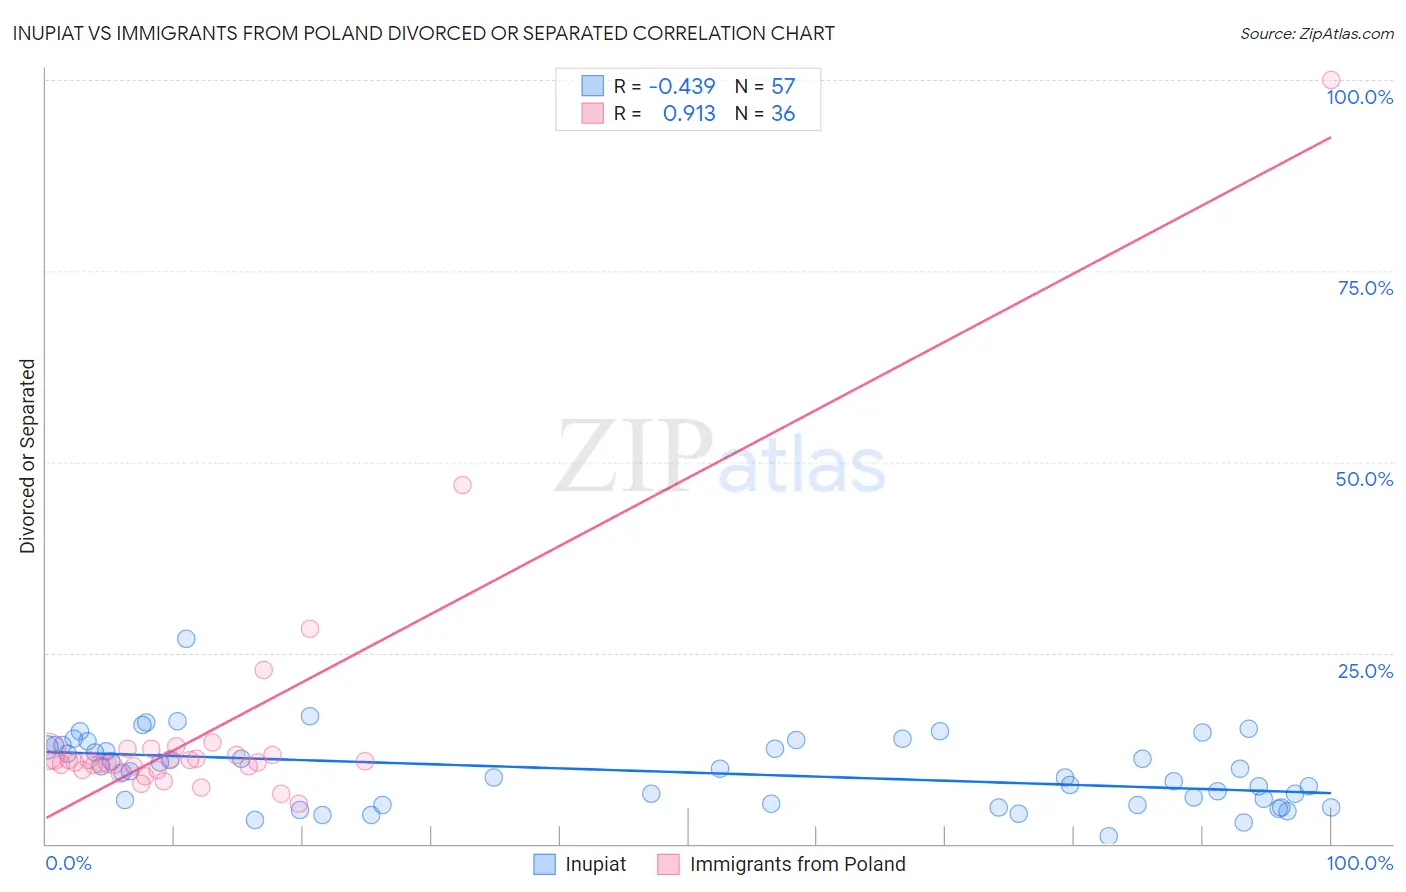
Inupiat vs Immigrants from Poland Divorced or Separated Correlation Chart
The statistical analysis conducted on geographies consisting of 96,343,887 people shows a moderate negative correlation between the proportion of Inupiat and percentage of population currently divorced or separated in the United States with a correlation coefficient (R) of -0.439 and weighted average of 11.4%. Similarly, the statistical analysis conducted on geographies consisting of 304,831,025 people shows a near-perfect positive correlation between the proportion of Immigrants from Poland and percentage of population currently divorced or separated in the United States with a correlation coefficient (R) of 0.913 and weighted average of 11.2%, a difference of 2.0%.
Divorced or Separated Correlation Summary
| Measurement | Inupiat | Immigrants from Poland |
| Minimum | 1.0% | 5.2% |
| Maximum | 26.8% | 100.0% |
| Range | 25.8% | 94.8% |
| Mean | 9.5% | 14.6% |
| Median | 9.6% | 10.7% |
| Interquartile 25% (IQ1) | 5.2% | 9.9% |
| Interquartile 75% (IQ3) | 13.0% | 11.9% |
| Interquartile Range (IQR) | 7.8% | 2.0% |
| Standard Deviation (Sample) | 4.7% | 16.3% |
| Standard Deviation (Population) | 4.7% | 16.1% |
Demographics Similar to Inupiat and Immigrants from Poland by Divorced or Separated
In terms of divorced or separated, the demographic groups most similar to Inupiat are Immigrants from South Eastern Asia (11.4%, a difference of 0.14%), Macedonian (11.4%, a difference of 0.18%), Immigrants from Kuwait (11.3%, a difference of 0.68%), Luxembourger (11.3%, a difference of 0.69%), and Immigrants from Russia (11.3%, a difference of 0.70%). Similarly, the demographic groups most similar to Immigrants from Poland are Laotian (11.2%, a difference of 0.010%), Immigrants from Turkey (11.2%, a difference of 0.030%), Immigrants from Saudi Arabia (11.2%, a difference of 0.040%), Bolivian (11.2%, a difference of 0.10%), and Immigrants from Bolivia (11.3%, a difference of 0.40%).
| Demographics | Rating | Rank | Divorced or Separated |
| Laotians | 100.0 /100 | #46 | Exceptional 11.2% |
| Immigrants | Poland | 100.0 /100 | #47 | Exceptional 11.2% |
| Immigrants | Turkey | 100.0 /100 | #48 | Exceptional 11.2% |
| Immigrants | Saudi Arabia | 100.0 /100 | #49 | Exceptional 11.2% |
| Bolivians | 100.0 /100 | #50 | Exceptional 11.2% |
| Immigrants | Bolivia | 100.0 /100 | #51 | Exceptional 11.3% |
| Immigrants | Australia | 99.9 /100 | #52 | Exceptional 11.3% |
| Immigrants | Lithuania | 99.9 /100 | #53 | Exceptional 11.3% |
| Eastern Europeans | 99.9 /100 | #54 | Exceptional 11.3% |
| Immigrants | Yemen | 99.9 /100 | #55 | Exceptional 11.3% |
| Immigrants | Philippines | 99.9 /100 | #56 | Exceptional 11.3% |
| Immigrants | Vietnam | 99.9 /100 | #57 | Exceptional 11.3% |
| Sri Lankans | 99.9 /100 | #58 | Exceptional 11.3% |
| Israelis | 99.9 /100 | #59 | Exceptional 11.3% |
| Immigrants | Russia | 99.9 /100 | #60 | Exceptional 11.3% |
| Koreans | 99.9 /100 | #61 | Exceptional 11.3% |
| Luxembourgers | 99.9 /100 | #62 | Exceptional 11.3% |
| Immigrants | Kuwait | 99.9 /100 | #63 | Exceptional 11.3% |
| Macedonians | 99.8 /100 | #64 | Exceptional 11.4% |
| Immigrants | South Eastern Asia | 99.8 /100 | #65 | Exceptional 11.4% |
| Inupiat | 99.8 /100 | #66 | Exceptional 11.4% |