Inupiat vs Immigrants from Poland Doctorate Degree
COMPARE
Inupiat
Immigrants from Poland
Doctorate Degree
Doctorate Degree Comparison
Inupiat
Immigrants from Poland
1.3%
DOCTORATE DEGREE
0.0/ 100
METRIC RATING
328th/ 347
METRIC RANK
1.7%
DOCTORATE DEGREE
7.4/ 100
METRIC RATING
224th/ 347
METRIC RANK
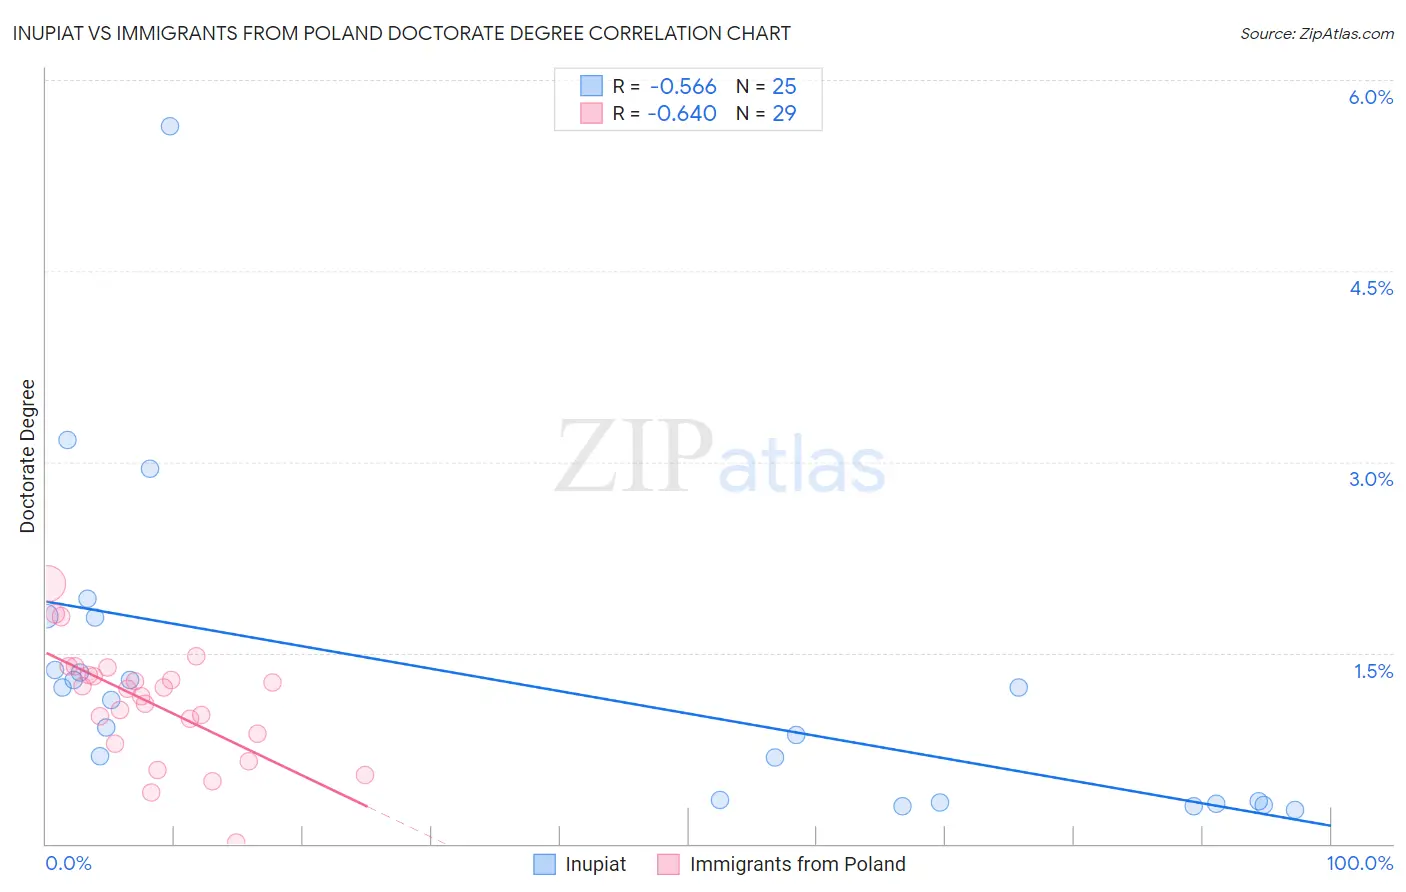
Inupiat vs Immigrants from Poland Doctorate Degree Correlation Chart
The statistical analysis conducted on geographies consisting of 95,805,354 people shows a substantial negative correlation between the proportion of Inupiat and percentage of population with at least doctorate degree education in the United States with a correlation coefficient (R) of -0.566 and weighted average of 1.3%. Similarly, the statistical analysis conducted on geographies consisting of 303,139,955 people shows a significant negative correlation between the proportion of Immigrants from Poland and percentage of population with at least doctorate degree education in the United States with a correlation coefficient (R) of -0.640 and weighted average of 1.7%, a difference of 27.7%.
Doctorate Degree Correlation Summary
| Measurement | Inupiat | Immigrants from Poland |
| Minimum | 0.27% | 0.013% |
| Maximum | 5.6% | 2.0% |
| Range | 5.4% | 2.0% |
| Mean | 1.3% | 1.1% |
| Median | 1.1% | 1.2% |
| Interquartile 25% (IQ1) | 0.33% | 0.83% |
| Interquartile 75% (IQ3) | 1.6% | 1.4% |
| Interquartile Range (IQR) | 1.2% | 0.53% |
| Standard Deviation (Sample) | 1.2% | 0.44% |
| Standard Deviation (Population) | 1.2% | 0.44% |
Similar Demographics by Doctorate Degree
Demographics Similar to Inupiat by Doctorate Degree
In terms of doctorate degree, the demographic groups most similar to Inupiat are Haitian (1.3%, a difference of 0.050%), Yup'ik (1.3%, a difference of 0.27%), Immigrants from Latin America (1.3%, a difference of 0.28%), Hispanic or Latino (1.3%, a difference of 0.58%), and Immigrants from Cabo Verde (1.3%, a difference of 0.87%).
| Demographics | Rating | Rank | Doctorate Degree |
| Dutch West Indians | 0.1 /100 | #321 | Tragic 1.3% |
| Seminole | 0.1 /100 | #322 | Tragic 1.3% |
| Immigrants | Belize | 0.1 /100 | #323 | Tragic 1.3% |
| Natives/Alaskans | 0.0 /100 | #324 | Tragic 1.3% |
| Pima | 0.0 /100 | #325 | Tragic 1.3% |
| Immigrants | Cabo Verde | 0.0 /100 | #326 | Tragic 1.3% |
| Hispanics or Latinos | 0.0 /100 | #327 | Tragic 1.3% |
| Inupiat | 0.0 /100 | #328 | Tragic 1.3% |
| Haitians | 0.0 /100 | #329 | Tragic 1.3% |
| Yup'ik | 0.0 /100 | #330 | Tragic 1.3% |
| Immigrants | Latin America | 0.0 /100 | #331 | Tragic 1.3% |
| Yakama | 0.0 /100 | #332 | Tragic 1.3% |
| Immigrants | Caribbean | 0.0 /100 | #333 | Tragic 1.3% |
| Immigrants | Dominican Republic | 0.0 /100 | #334 | Tragic 1.3% |
| Immigrants | Haiti | 0.0 /100 | #335 | Tragic 1.3% |
Demographics Similar to Immigrants from Poland by Doctorate Degree
In terms of doctorate degree, the demographic groups most similar to Immigrants from Poland are Immigrants from Bosnia and Herzegovina (1.7%, a difference of 0.22%), Immigrants from Colombia (1.7%, a difference of 0.49%), Osage (1.7%, a difference of 0.61%), Immigrants from Venezuela (1.7%, a difference of 0.68%), and Nonimmigrants (1.7%, a difference of 0.75%).
| Demographics | Rating | Rank | Doctorate Degree |
| Spanish Americans | 12.9 /100 | #217 | Poor 1.7% |
| Tlingit-Haida | 11.9 /100 | #218 | Poor 1.7% |
| Immigrants | Iraq | 10.7 /100 | #219 | Poor 1.7% |
| Immigrants | Uruguay | 9.2 /100 | #220 | Tragic 1.7% |
| Immigrants | Nonimmigrants | 8.8 /100 | #221 | Tragic 1.7% |
| Immigrants | Venezuela | 8.7 /100 | #222 | Tragic 1.7% |
| Immigrants | Bosnia and Herzegovina | 7.8 /100 | #223 | Tragic 1.7% |
| Immigrants | Poland | 7.4 /100 | #224 | Tragic 1.7% |
| Immigrants | Colombia | 6.7 /100 | #225 | Tragic 1.7% |
| Osage | 6.5 /100 | #226 | Tragic 1.7% |
| Panamanians | 6.3 /100 | #227 | Tragic 1.7% |
| Assyrians/Chaldeans/Syriacs | 5.9 /100 | #228 | Tragic 1.7% |
| Colville | 4.7 /100 | #229 | Tragic 1.6% |
| Immigrants | Philippines | 4.3 /100 | #230 | Tragic 1.6% |
| Immigrants | North Macedonia | 3.9 /100 | #231 | Tragic 1.6% |