Native/Alaskan vs Immigrants from England Single Female Poverty
COMPARE
Native/Alaskan
Immigrants from England
Single Female Poverty
Single Female Poverty Comparison
Natives/Alaskans
Immigrants from England
28.2%
SINGLE FEMALE POVERTY
0.0/ 100
METRIC RATING
331st/ 347
METRIC RANK
20.2%
SINGLE FEMALE POVERTY
91.9/ 100
METRIC RATING
133rd/ 347
METRIC RANK
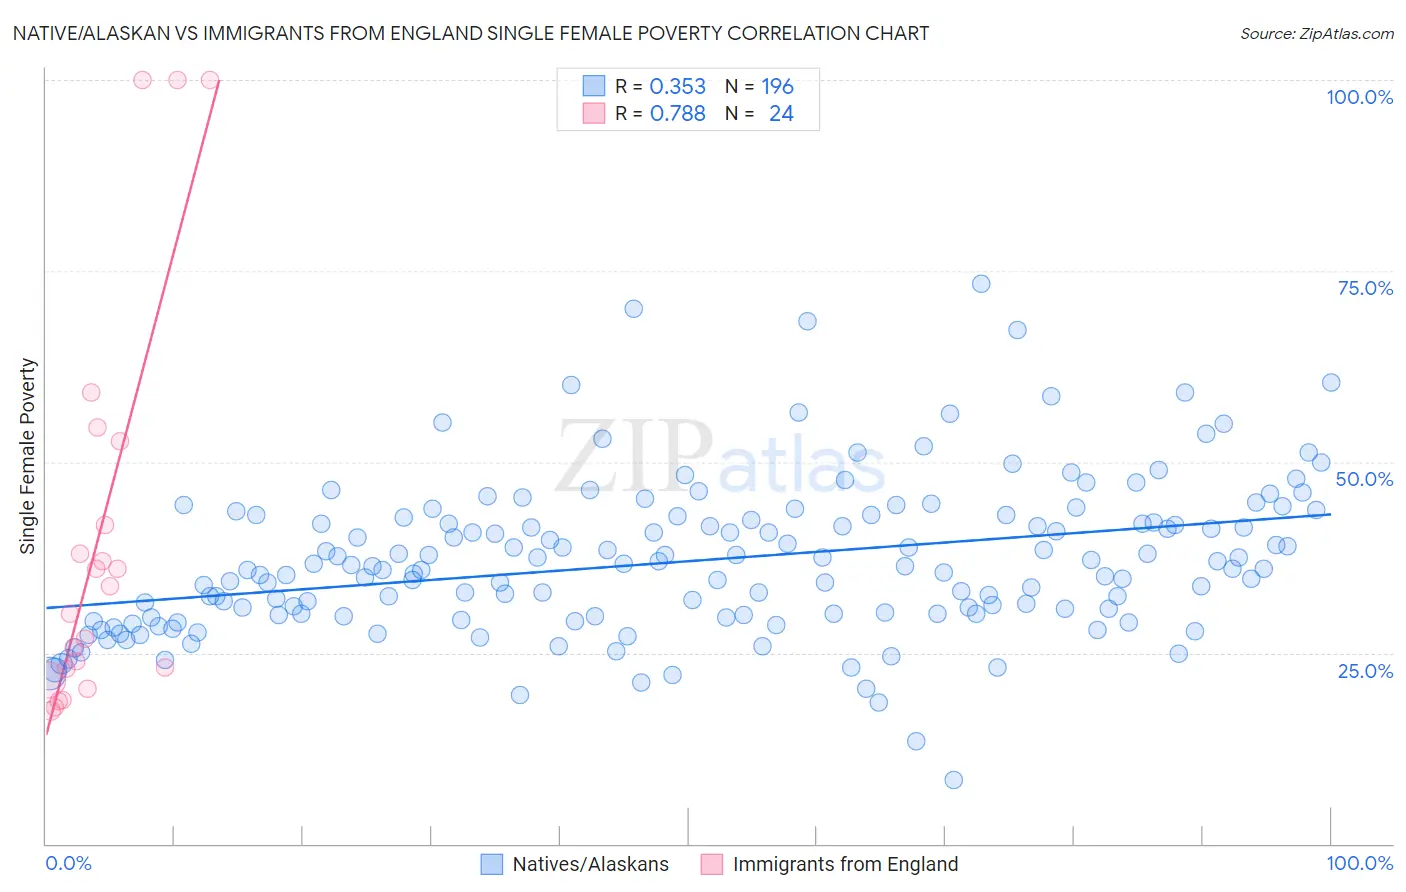
Native/Alaskan vs Immigrants from England Single Female Poverty Correlation Chart
The statistical analysis conducted on geographies consisting of 503,027,149 people shows a mild positive correlation between the proportion of Natives/Alaskans and poverty level among single females in the United States with a correlation coefficient (R) of 0.353 and weighted average of 28.2%. Similarly, the statistical analysis conducted on geographies consisting of 384,642,935 people shows a strong positive correlation between the proportion of Immigrants from England and poverty level among single females in the United States with a correlation coefficient (R) of 0.788 and weighted average of 20.2%, a difference of 39.6%.
Single Female Poverty Correlation Summary
| Measurement | Native/Alaskan | Immigrants from England |
| Minimum | 8.3% | 17.4% |
| Maximum | 73.3% | 100.0% |
| Range | 65.1% | 82.6% |
| Mean | 37.0% | 39.8% |
| Median | 36.0% | 32.0% |
| Interquartile 25% (IQ1) | 30.0% | 22.2% |
| Interquartile 75% (IQ3) | 42.5% | 47.2% |
| Interquartile Range (IQR) | 12.5% | 25.0% |
| Standard Deviation (Sample) | 10.1% | 26.0% |
| Standard Deviation (Population) | 10.1% | 25.5% |
Similar Demographics by Single Female Poverty
Demographics Similar to Natives/Alaskans by Single Female Poverty
In terms of single female poverty, the demographic groups most similar to Natives/Alaskans are Yakama (28.3%, a difference of 0.26%), Hopi (28.0%, a difference of 0.64%), Ute (28.4%, a difference of 0.68%), Menominee (27.8%, a difference of 1.3%), and Pueblo (28.6%, a difference of 1.4%).
| Demographics | Rating | Rank | Single Female Poverty |
| Kiowa | 0.0 /100 | #324 | Tragic 26.9% |
| Choctaw | 0.0 /100 | #325 | Tragic 27.2% |
| Creek | 0.0 /100 | #326 | Tragic 27.4% |
| Dutch West Indians | 0.0 /100 | #327 | Tragic 27.5% |
| Apache | 0.0 /100 | #328 | Tragic 27.7% |
| Menominee | 0.0 /100 | #329 | Tragic 27.8% |
| Hopi | 0.0 /100 | #330 | Tragic 28.0% |
| Natives/Alaskans | 0.0 /100 | #331 | Tragic 28.2% |
| Yakama | 0.0 /100 | #332 | Tragic 28.3% |
| Ute | 0.0 /100 | #333 | Tragic 28.4% |
| Pueblo | 0.0 /100 | #334 | Tragic 28.6% |
| Immigrants | Yemen | 0.0 /100 | #335 | Tragic 28.9% |
| Colville | 0.0 /100 | #336 | Tragic 29.1% |
| Yuman | 0.0 /100 | #337 | Tragic 29.4% |
| Pima | 0.0 /100 | #338 | Tragic 30.3% |
Demographics Similar to Immigrants from England by Single Female Poverty
In terms of single female poverty, the demographic groups most similar to Immigrants from England are Pakistani (20.2%, a difference of 0.030%), Uruguayan (20.2%, a difference of 0.030%), Immigrants from Hungary (20.2%, a difference of 0.090%), Immigrants from Venezuela (20.2%, a difference of 0.090%), and Immigrants from Morocco (20.2%, a difference of 0.11%).
| Demographics | Rating | Rank | Single Female Poverty |
| Serbians | 93.3 /100 | #126 | Exceptional 20.1% |
| Mongolians | 93.2 /100 | #127 | Exceptional 20.2% |
| Immigrants | Spain | 92.7 /100 | #128 | Exceptional 20.2% |
| Immigrants | Morocco | 92.4 /100 | #129 | Exceptional 20.2% |
| Immigrants | Hungary | 92.3 /100 | #130 | Exceptional 20.2% |
| Pakistanis | 92.1 /100 | #131 | Exceptional 20.2% |
| Uruguayans | 92.1 /100 | #132 | Exceptional 20.2% |
| Immigrants | England | 91.9 /100 | #133 | Exceptional 20.2% |
| Immigrants | Venezuela | 91.5 /100 | #134 | Exceptional 20.2% |
| Immigrants | Iraq | 91.2 /100 | #135 | Exceptional 20.2% |
| Immigrants | Canada | 91.2 /100 | #136 | Exceptional 20.2% |
| Immigrants | Nepal | 90.6 /100 | #137 | Exceptional 20.3% |
| Slovenes | 90.5 /100 | #138 | Exceptional 20.3% |
| Immigrants | Kuwait | 90.4 /100 | #139 | Exceptional 20.3% |
| Syrians | 90.4 /100 | #140 | Exceptional 20.3% |