Immigrants from South Eastern Asia vs Laotian Poverty
COMPARE
Immigrants from South Eastern Asia
Laotian
Poverty
Poverty Comparison
Immigrants from South Eastern Asia
Laotians
11.7%
POVERTY
88.9/ 100
METRIC RATING
120th/ 347
METRIC RANK
11.6%
POVERTY
92.4/ 100
METRIC RATING
102nd/ 347
METRIC RANK
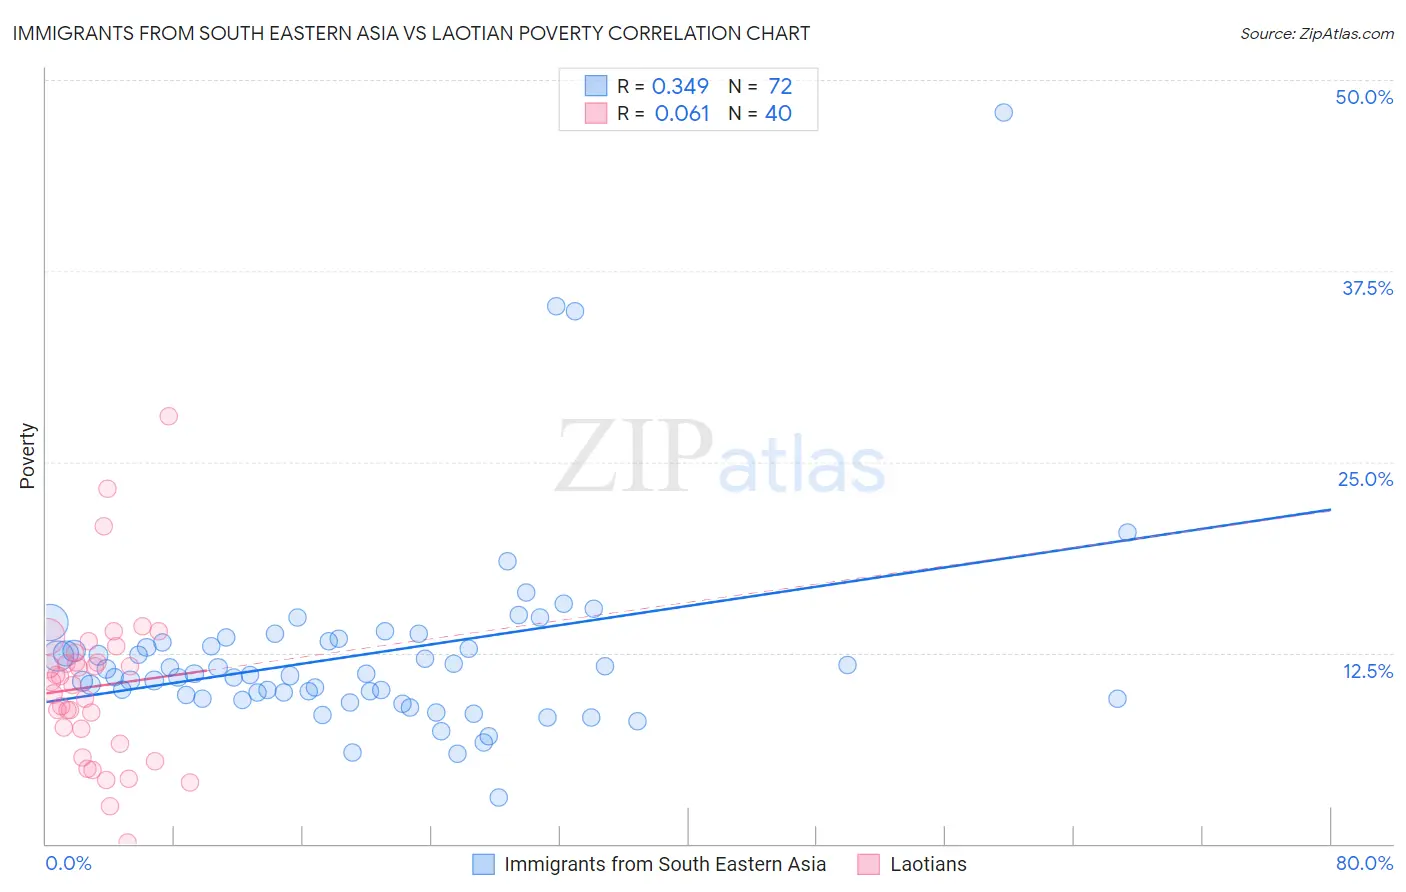
Immigrants from South Eastern Asia vs Laotian Poverty Correlation Chart
The statistical analysis conducted on geographies consisting of 512,258,667 people shows a mild positive correlation between the proportion of Immigrants from South Eastern Asia and poverty level in the United States with a correlation coefficient (R) of 0.349 and weighted average of 11.7%. Similarly, the statistical analysis conducted on geographies consisting of 224,750,373 people shows a slight positive correlation between the proportion of Laotians and poverty level in the United States with a correlation coefficient (R) of 0.061 and weighted average of 11.6%, a difference of 1.1%.
Poverty Correlation Summary
| Measurement | Immigrants from South Eastern Asia | Laotian |
| Minimum | 3.0% | 0.072% |
| Maximum | 47.9% | 28.0% |
| Range | 44.9% | 27.9% |
| Mean | 12.4% | 10.3% |
| Median | 11.1% | 10.5% |
| Interquartile 25% (IQ1) | 9.6% | 7.1% |
| Interquartile 75% (IQ3) | 13.2% | 12.2% |
| Interquartile Range (IQR) | 3.6% | 5.1% |
| Standard Deviation (Sample) | 6.4% | 5.3% |
| Standard Deviation (Population) | 6.4% | 5.3% |
Demographics Similar to Immigrants from South Eastern Asia and Laotians by Poverty
In terms of poverty, the demographic groups most similar to Immigrants from South Eastern Asia are Tlingit-Haida (11.7%, a difference of 0.010%), Argentinean (11.7%, a difference of 0.050%), New Zealander (11.7%, a difference of 0.060%), Sri Lankan (11.7%, a difference of 0.13%), and Immigrants from Russia (11.7%, a difference of 0.20%). Similarly, the demographic groups most similar to Laotians are Okinawan (11.6%, a difference of 0.010%), Native Hawaiian (11.6%, a difference of 0.11%), Portuguese (11.6%, a difference of 0.13%), Immigrants from Zimbabwe (11.6%, a difference of 0.13%), and Palestinian (11.6%, a difference of 0.22%).
| Demographics | Rating | Rank | Poverty |
| Slavs | 93.3 /100 | #101 | Exceptional 11.5% |
| Laotians | 92.4 /100 | #102 | Exceptional 11.6% |
| Okinawans | 92.4 /100 | #103 | Exceptional 11.6% |
| Native Hawaiians | 92.1 /100 | #104 | Exceptional 11.6% |
| Portuguese | 92.1 /100 | #105 | Exceptional 11.6% |
| Immigrants | Zimbabwe | 92.1 /100 | #106 | Exceptional 11.6% |
| Palestinians | 91.8 /100 | #107 | Exceptional 11.6% |
| Canadians | 91.7 /100 | #108 | Exceptional 11.6% |
| Immigrants | Turkey | 91.7 /100 | #109 | Exceptional 11.6% |
| Welsh | 91.6 /100 | #110 | Exceptional 11.6% |
| French Canadians | 91.0 /100 | #111 | Exceptional 11.6% |
| Immigrants | Southern Europe | 90.8 /100 | #112 | Exceptional 11.6% |
| Immigrants | Belarus | 90.8 /100 | #113 | Exceptional 11.6% |
| Immigrants | China | 90.7 /100 | #114 | Exceptional 11.6% |
| Albanians | 90.3 /100 | #115 | Exceptional 11.7% |
| Immigrants | Russia | 89.7 /100 | #116 | Excellent 11.7% |
| Sri Lankans | 89.4 /100 | #117 | Excellent 11.7% |
| Argentineans | 89.1 /100 | #118 | Excellent 11.7% |
| Tlingit-Haida | 89.0 /100 | #119 | Excellent 11.7% |
| Immigrants | South Eastern Asia | 88.9 /100 | #120 | Excellent 11.7% |
| New Zealanders | 88.7 /100 | #121 | Excellent 11.7% |