Immigrants from Sweden vs Laotian Poverty
COMPARE
Immigrants from Sweden
Laotian
Poverty
Poverty Comparison
Immigrants from Sweden
Laotians
11.3%
POVERTY
96.3/ 100
METRIC RATING
83rd/ 347
METRIC RANK
11.6%
POVERTY
92.4/ 100
METRIC RATING
102nd/ 347
METRIC RANK
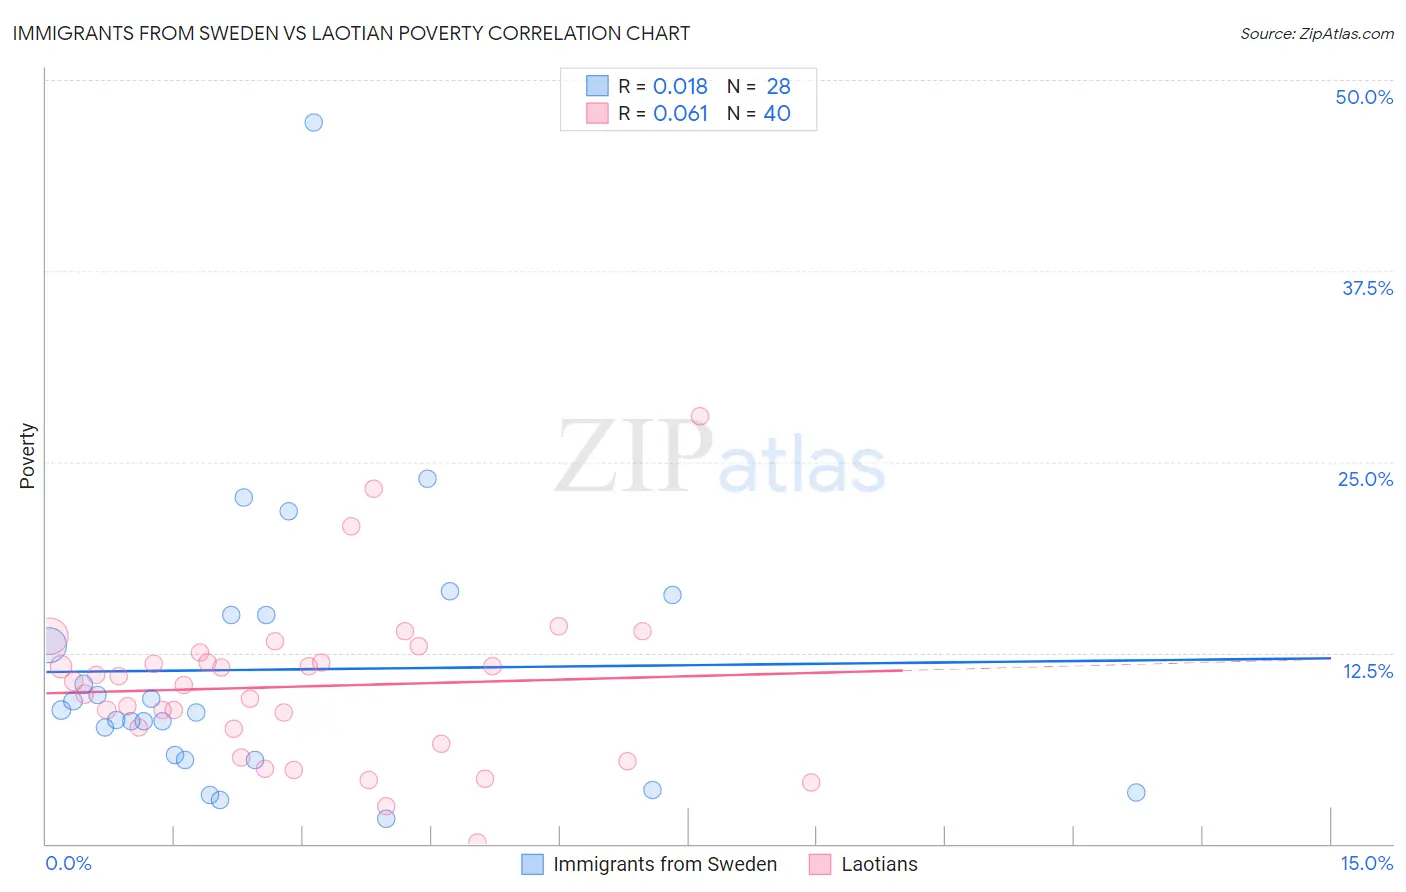
Immigrants from Sweden vs Laotian Poverty Correlation Chart
The statistical analysis conducted on geographies consisting of 164,694,810 people shows no correlation between the proportion of Immigrants from Sweden and poverty level in the United States with a correlation coefficient (R) of 0.018 and weighted average of 11.3%. Similarly, the statistical analysis conducted on geographies consisting of 224,750,373 people shows a slight positive correlation between the proportion of Laotians and poverty level in the United States with a correlation coefficient (R) of 0.061 and weighted average of 11.6%, a difference of 2.0%.
Poverty Correlation Summary
| Measurement | Immigrants from Sweden | Laotian |
| Minimum | 1.7% | 0.072% |
| Maximum | 47.2% | 28.0% |
| Range | 45.6% | 27.9% |
| Mean | 11.4% | 10.3% |
| Median | 8.7% | 10.5% |
| Interquartile 25% (IQ1) | 5.7% | 7.1% |
| Interquartile 75% (IQ3) | 15.0% | 12.2% |
| Interquartile Range (IQR) | 9.3% | 5.1% |
| Standard Deviation (Sample) | 9.2% | 5.3% |
| Standard Deviation (Population) | 9.1% | 5.3% |
Demographics Similar to Immigrants from Sweden and Laotians by Poverty
In terms of poverty, the demographic groups most similar to Immigrants from Sweden are English (11.3%, a difference of 0.010%), Immigrants from England (11.4%, a difference of 0.080%), Egyptian (11.3%, a difference of 0.18%), Jordanian (11.4%, a difference of 0.19%), and Northern European (11.4%, a difference of 0.20%). Similarly, the demographic groups most similar to Laotians are Slavic (11.5%, a difference of 0.34%), Scottish (11.5%, a difference of 0.65%), Immigrants from Indonesia (11.5%, a difference of 0.76%), Immigrants from Latvia (11.5%, a difference of 0.90%), and Immigrants from Egypt (11.5%, a difference of 0.93%).
| Demographics | Rating | Rank | Poverty |
| Egyptians | 96.5 /100 | #82 | Exceptional 11.3% |
| Immigrants | Sweden | 96.3 /100 | #83 | Exceptional 11.3% |
| English | 96.3 /100 | #84 | Exceptional 11.3% |
| Immigrants | England | 96.2 /100 | #85 | Exceptional 11.4% |
| Jordanians | 96.0 /100 | #86 | Exceptional 11.4% |
| Northern Europeans | 96.0 /100 | #87 | Exceptional 11.4% |
| Belgians | 95.8 /100 | #88 | Exceptional 11.4% |
| Czechoslovakians | 95.7 /100 | #89 | Exceptional 11.4% |
| Immigrants | Denmark | 95.5 /100 | #90 | Exceptional 11.4% |
| Finns | 95.2 /100 | #91 | Exceptional 11.4% |
| British | 95.0 /100 | #92 | Exceptional 11.4% |
| Romanians | 94.9 /100 | #93 | Exceptional 11.4% |
| Paraguayans | 94.9 /100 | #94 | Exceptional 11.4% |
| Australians | 94.9 /100 | #95 | Exceptional 11.4% |
| Immigrants | South Africa | 94.7 /100 | #96 | Exceptional 11.5% |
| Immigrants | Egypt | 94.6 /100 | #97 | Exceptional 11.5% |
| Immigrants | Latvia | 94.5 /100 | #98 | Exceptional 11.5% |
| Immigrants | Indonesia | 94.2 /100 | #99 | Exceptional 11.5% |
| Scottish | 94.0 /100 | #100 | Exceptional 11.5% |
| Slavs | 93.3 /100 | #101 | Exceptional 11.5% |
| Laotians | 92.4 /100 | #102 | Exceptional 11.6% |