Immigrants from South Eastern Asia vs Costa Rican Poverty
COMPARE
Immigrants from South Eastern Asia
Costa Rican
Poverty
Poverty Comparison
Immigrants from South Eastern Asia
Costa Ricans
11.7%
POVERTY
88.9/ 100
METRIC RATING
120th/ 347
METRIC RANK
12.2%
POVERTY
62.2/ 100
METRIC RATING
157th/ 347
METRIC RANK
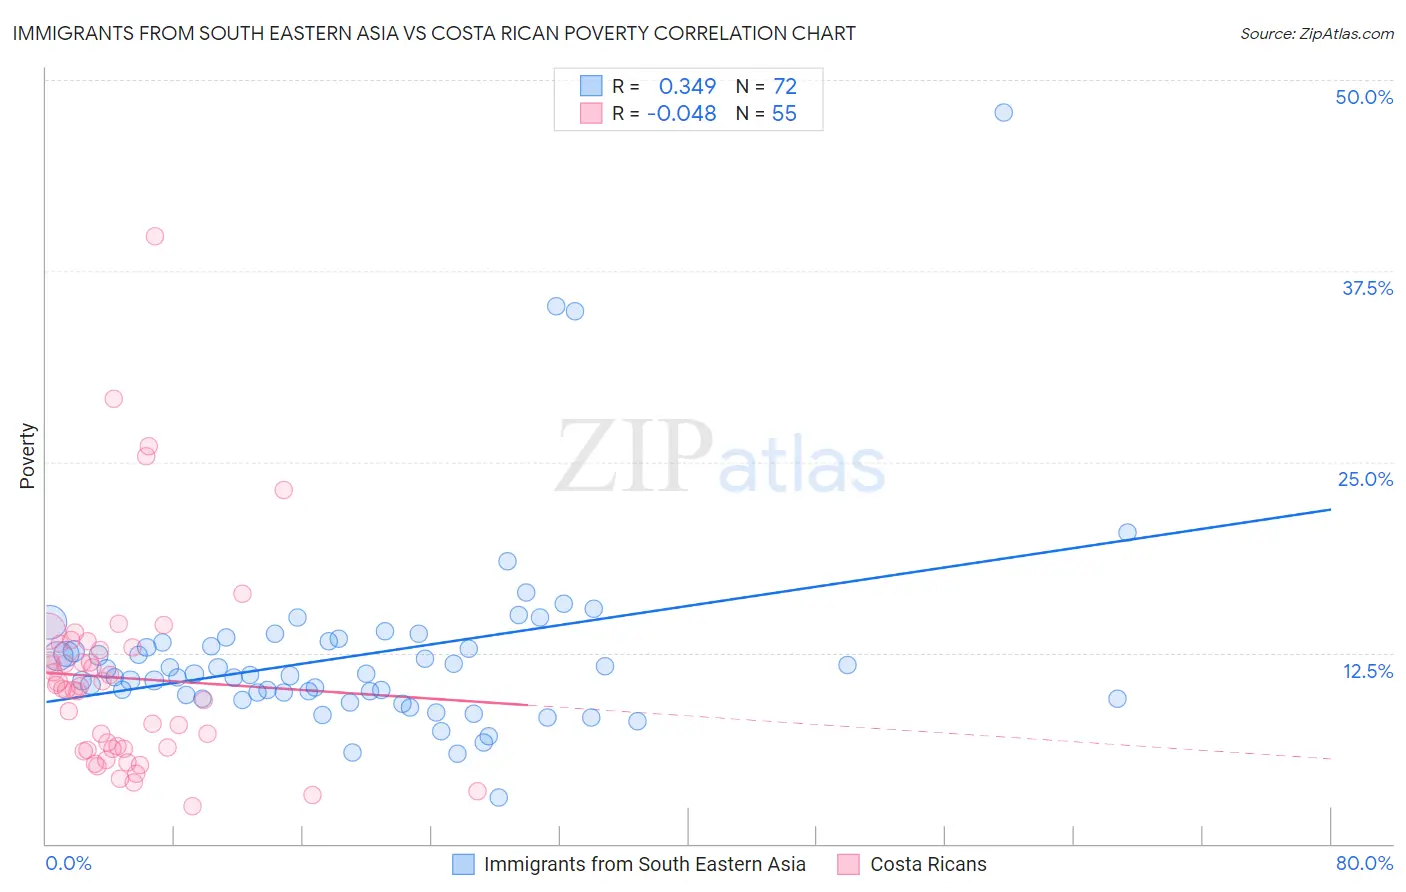
Immigrants from South Eastern Asia vs Costa Rican Poverty Correlation Chart
The statistical analysis conducted on geographies consisting of 512,258,667 people shows a mild positive correlation between the proportion of Immigrants from South Eastern Asia and poverty level in the United States with a correlation coefficient (R) of 0.349 and weighted average of 11.7%. Similarly, the statistical analysis conducted on geographies consisting of 253,487,550 people shows no correlation between the proportion of Costa Ricans and poverty level in the United States with a correlation coefficient (R) of -0.048 and weighted average of 12.2%, a difference of 4.1%.
Poverty Correlation Summary
| Measurement | Immigrants from South Eastern Asia | Costa Rican |
| Minimum | 3.0% | 2.4% |
| Maximum | 47.9% | 39.8% |
| Range | 44.9% | 37.4% |
| Mean | 12.4% | 10.8% |
| Median | 11.1% | 10.2% |
| Interquartile 25% (IQ1) | 9.6% | 6.2% |
| Interquartile 75% (IQ3) | 13.2% | 12.8% |
| Interquartile Range (IQR) | 3.6% | 6.6% |
| Standard Deviation (Sample) | 6.4% | 6.9% |
| Standard Deviation (Population) | 6.4% | 6.8% |
Similar Demographics by Poverty
Demographics Similar to Immigrants from South Eastern Asia by Poverty
In terms of poverty, the demographic groups most similar to Immigrants from South Eastern Asia are Tlingit-Haida (11.7%, a difference of 0.010%), Argentinean (11.7%, a difference of 0.050%), New Zealander (11.7%, a difference of 0.060%), Puget Sound Salish (11.7%, a difference of 0.060%), and Immigrants from Hungary (11.7%, a difference of 0.080%).
| Demographics | Rating | Rank | Poverty |
| Immigrants | Belarus | 90.8 /100 | #113 | Exceptional 11.6% |
| Immigrants | China | 90.7 /100 | #114 | Exceptional 11.6% |
| Albanians | 90.3 /100 | #115 | Exceptional 11.7% |
| Immigrants | Russia | 89.7 /100 | #116 | Excellent 11.7% |
| Sri Lankans | 89.4 /100 | #117 | Excellent 11.7% |
| Argentineans | 89.1 /100 | #118 | Excellent 11.7% |
| Tlingit-Haida | 89.0 /100 | #119 | Excellent 11.7% |
| Immigrants | South Eastern Asia | 88.9 /100 | #120 | Excellent 11.7% |
| New Zealanders | 88.7 /100 | #121 | Excellent 11.7% |
| Puget Sound Salish | 88.7 /100 | #122 | Excellent 11.7% |
| Immigrants | Hungary | 88.6 /100 | #123 | Excellent 11.7% |
| Soviet Union | 88.4 /100 | #124 | Excellent 11.7% |
| Immigrants | Brazil | 88.2 /100 | #125 | Excellent 11.7% |
| Immigrants | Norway | 88.0 /100 | #126 | Excellent 11.7% |
| Immigrants | Argentina | 88.0 /100 | #127 | Excellent 11.7% |
Demographics Similar to Costa Ricans by Poverty
In terms of poverty, the demographic groups most similar to Costa Ricans are Scotch-Irish (12.2%, a difference of 0.040%), Taiwanese (12.2%, a difference of 0.040%), Pennsylvania German (12.2%, a difference of 0.14%), Hungarian (12.2%, a difference of 0.15%), and Immigrants from Northern Africa (12.1%, a difference of 0.18%).
| Demographics | Rating | Rank | Poverty |
| Immigrants | Kazakhstan | 72.3 /100 | #150 | Good 12.0% |
| Samoans | 71.9 /100 | #151 | Good 12.0% |
| Armenians | 67.6 /100 | #152 | Good 12.1% |
| Immigrants | Northern Africa | 63.9 /100 | #153 | Good 12.1% |
| Guamanians/Chamorros | 63.9 /100 | #154 | Good 12.1% |
| Hungarians | 63.6 /100 | #155 | Good 12.2% |
| Scotch-Irish | 62.6 /100 | #156 | Good 12.2% |
| Costa Ricans | 62.2 /100 | #157 | Good 12.2% |
| Taiwanese | 61.8 /100 | #158 | Good 12.2% |
| Pennsylvania Germans | 60.8 /100 | #159 | Good 12.2% |
| Immigrants | Nepal | 60.4 /100 | #160 | Good 12.2% |
| Immigrants | Fiji | 59.1 /100 | #161 | Average 12.2% |
| Ethiopians | 59.1 /100 | #162 | Average 12.2% |
| Immigrants | Ethiopia | 58.6 /100 | #163 | Average 12.2% |
| Colombians | 57.8 /100 | #164 | Average 12.2% |