Immigrants from Moldova vs Laotian Poverty
COMPARE
Immigrants from Moldova
Laotian
Poverty
Poverty Comparison
Immigrants from Moldova
Laotians
10.9%
POVERTY
99.1/ 100
METRIC RATING
44th/ 347
METRIC RANK
11.6%
POVERTY
92.4/ 100
METRIC RATING
102nd/ 347
METRIC RANK
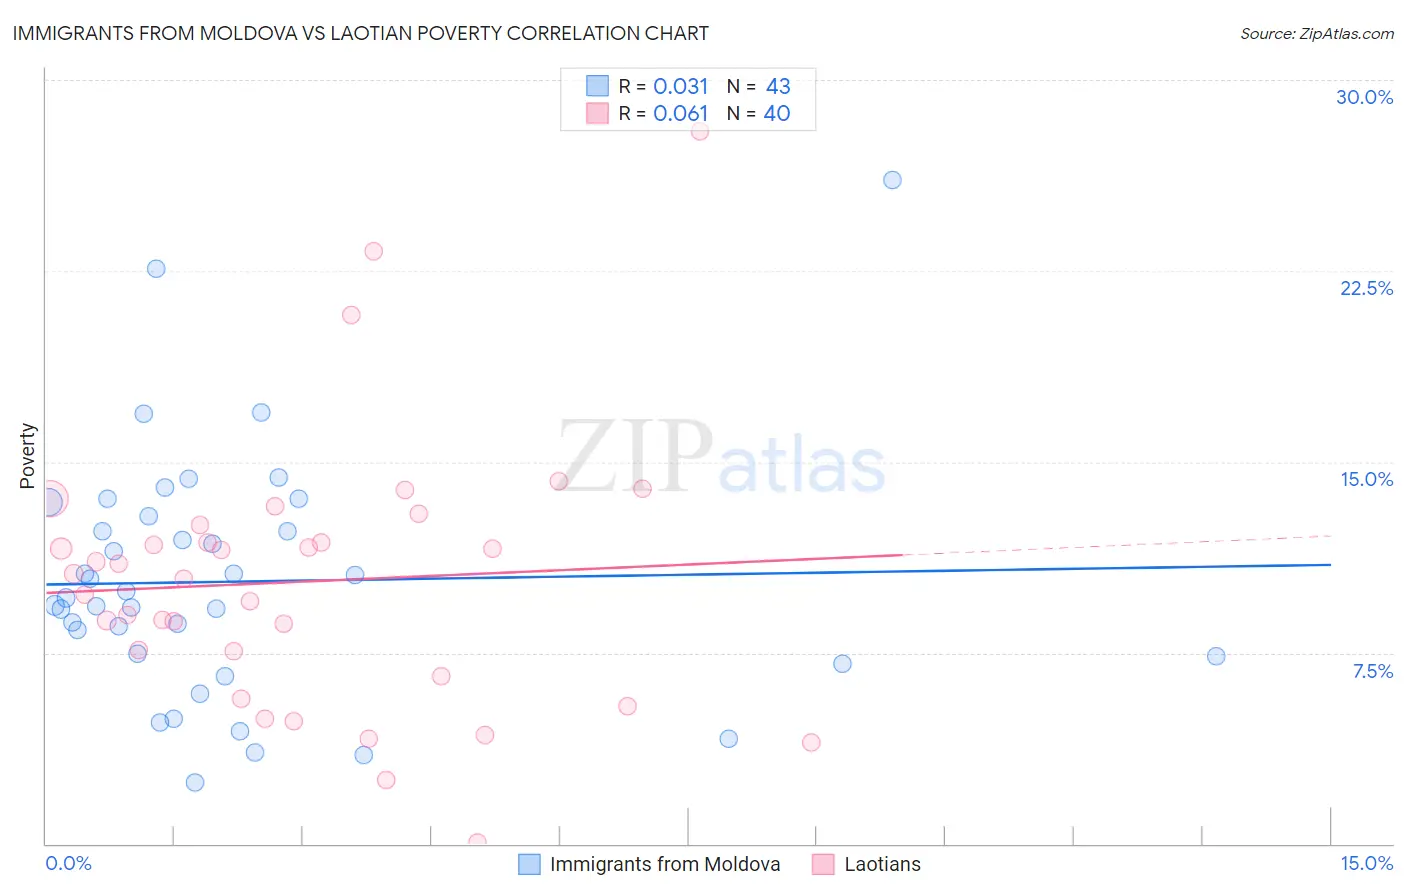
Immigrants from Moldova vs Laotian Poverty Correlation Chart
The statistical analysis conducted on geographies consisting of 124,373,713 people shows no correlation between the proportion of Immigrants from Moldova and poverty level in the United States with a correlation coefficient (R) of 0.031 and weighted average of 10.9%. Similarly, the statistical analysis conducted on geographies consisting of 224,750,373 people shows a slight positive correlation between the proportion of Laotians and poverty level in the United States with a correlation coefficient (R) of 0.061 and weighted average of 11.6%, a difference of 6.1%.
Poverty Correlation Summary
| Measurement | Immigrants from Moldova | Laotian |
| Minimum | 2.4% | 0.072% |
| Maximum | 26.1% | 28.0% |
| Range | 23.7% | 27.9% |
| Mean | 10.3% | 10.3% |
| Median | 9.7% | 10.5% |
| Interquartile 25% (IQ1) | 7.4% | 7.1% |
| Interquartile 75% (IQ3) | 12.9% | 12.2% |
| Interquartile Range (IQR) | 5.5% | 5.1% |
| Standard Deviation (Sample) | 4.8% | 5.3% |
| Standard Deviation (Population) | 4.7% | 5.3% |
Similar Demographics by Poverty
Demographics Similar to Immigrants from Moldova by Poverty
In terms of poverty, the demographic groups most similar to Immigrants from Moldova are Immigrants from Singapore (10.9%, a difference of 0.14%), Korean (10.9%, a difference of 0.19%), Immigrants from Iran (10.9%, a difference of 0.41%), Russian (10.9%, a difference of 0.50%), and Turkish (11.0%, a difference of 0.51%).
| Demographics | Rating | Rank | Poverty |
| Immigrants | Greece | 99.3 /100 | #37 | Exceptional 10.8% |
| Czechs | 99.3 /100 | #38 | Exceptional 10.8% |
| Immigrants | Pakistan | 99.3 /100 | #39 | Exceptional 10.8% |
| Russians | 99.3 /100 | #40 | Exceptional 10.9% |
| Immigrants | Iran | 99.2 /100 | #41 | Exceptional 10.9% |
| Koreans | 99.2 /100 | #42 | Exceptional 10.9% |
| Immigrants | Singapore | 99.2 /100 | #43 | Exceptional 10.9% |
| Immigrants | Moldova | 99.1 /100 | #44 | Exceptional 10.9% |
| Turks | 98.9 /100 | #45 | Exceptional 11.0% |
| Immigrants | Czechoslovakia | 98.9 /100 | #46 | Exceptional 11.0% |
| Immigrants | Romania | 98.9 /100 | #47 | Exceptional 11.0% |
| Slovenes | 98.9 /100 | #48 | Exceptional 11.0% |
| Immigrants | Japan | 98.9 /100 | #49 | Exceptional 11.0% |
| Asians | 98.9 /100 | #50 | Exceptional 11.0% |
| Immigrants | Croatia | 98.7 /100 | #51 | Exceptional 11.0% |
Demographics Similar to Laotians by Poverty
In terms of poverty, the demographic groups most similar to Laotians are Okinawan (11.6%, a difference of 0.010%), Native Hawaiian (11.6%, a difference of 0.11%), Portuguese (11.6%, a difference of 0.13%), Immigrants from Zimbabwe (11.6%, a difference of 0.13%), and Palestinian (11.6%, a difference of 0.22%).
| Demographics | Rating | Rank | Poverty |
| Australians | 94.9 /100 | #95 | Exceptional 11.4% |
| Immigrants | South Africa | 94.7 /100 | #96 | Exceptional 11.5% |
| Immigrants | Egypt | 94.6 /100 | #97 | Exceptional 11.5% |
| Immigrants | Latvia | 94.5 /100 | #98 | Exceptional 11.5% |
| Immigrants | Indonesia | 94.2 /100 | #99 | Exceptional 11.5% |
| Scottish | 94.0 /100 | #100 | Exceptional 11.5% |
| Slavs | 93.3 /100 | #101 | Exceptional 11.5% |
| Laotians | 92.4 /100 | #102 | Exceptional 11.6% |
| Okinawans | 92.4 /100 | #103 | Exceptional 11.6% |
| Native Hawaiians | 92.1 /100 | #104 | Exceptional 11.6% |
| Portuguese | 92.1 /100 | #105 | Exceptional 11.6% |
| Immigrants | Zimbabwe | 92.1 /100 | #106 | Exceptional 11.6% |
| Palestinians | 91.8 /100 | #107 | Exceptional 11.6% |
| Canadians | 91.7 /100 | #108 | Exceptional 11.6% |
| Immigrants | Turkey | 91.7 /100 | #109 | Exceptional 11.6% |