Immigrants from Russia vs Colombian Married-Couple Family Poverty
COMPARE
Immigrants from Russia
Colombian
Married-Couple Family Poverty
Married-Couple Family Poverty Comparison
Immigrants from Russia
Colombians
5.0%
MARRIED-COUPLE FAMILY POVERTY
78.7/ 100
METRIC RATING
148th/ 347
METRIC RANK
5.6%
MARRIED-COUPLE FAMILY POVERTY
9.2/ 100
METRIC RATING
220th/ 347
METRIC RANK
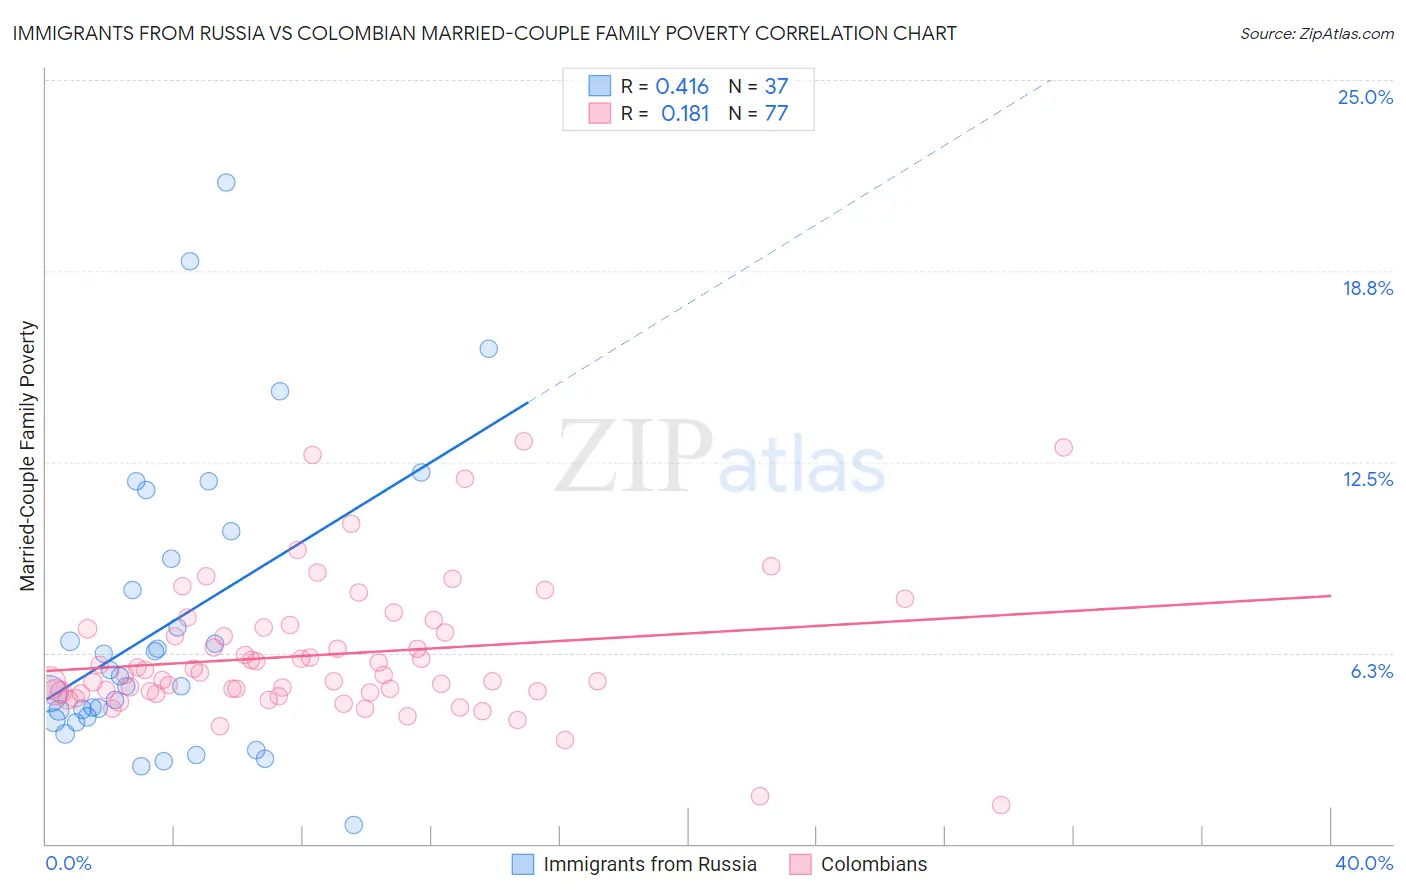
Immigrants from Russia vs Colombian Married-Couple Family Poverty Correlation Chart
The statistical analysis conducted on geographies consisting of 344,976,831 people shows a moderate positive correlation between the proportion of Immigrants from Russia and poverty level among married-couple families in the United States with a correlation coefficient (R) of 0.416 and weighted average of 5.0%. Similarly, the statistical analysis conducted on geographies consisting of 415,629,712 people shows a poor positive correlation between the proportion of Colombians and poverty level among married-couple families in the United States with a correlation coefficient (R) of 0.181 and weighted average of 5.6%, a difference of 10.9%.
Married-Couple Family Poverty Correlation Summary
| Measurement | Immigrants from Russia | Colombian |
| Minimum | 0.60% | 1.3% |
| Maximum | 21.6% | 13.2% |
| Range | 21.0% | 11.9% |
| Mean | 7.2% | 6.2% |
| Median | 5.5% | 5.5% |
| Interquartile 25% (IQ1) | 4.1% | 5.0% |
| Interquartile 75% (IQ3) | 9.8% | 7.1% |
| Interquartile Range (IQR) | 5.7% | 2.1% |
| Standard Deviation (Sample) | 4.8% | 2.2% |
| Standard Deviation (Population) | 4.7% | 2.2% |
Similar Demographics by Married-Couple Family Poverty
Demographics Similar to Immigrants from Russia by Married-Couple Family Poverty
In terms of married-couple family poverty, the demographic groups most similar to Immigrants from Russia are Syrian (5.0%, a difference of 0.0%), Immigrants from Oceania (5.0%, a difference of 0.030%), Brazilian (5.0%, a difference of 0.080%), Mongolian (5.0%, a difference of 0.20%), and Immigrants from Spain (5.0%, a difference of 0.21%).
| Demographics | Rating | Rank | Married-Couple Family Poverty |
| Immigrants | Brazil | 84.6 /100 | #141 | Excellent 5.0% |
| Immigrants | China | 84.6 /100 | #142 | Excellent 5.0% |
| Immigrants | Egypt | 83.4 /100 | #143 | Excellent 5.0% |
| Hmong | 83.2 /100 | #144 | Excellent 5.0% |
| Immigrants | Spain | 79.9 /100 | #145 | Good 5.0% |
| Mongolians | 79.8 /100 | #146 | Good 5.0% |
| Syrians | 78.7 /100 | #147 | Good 5.0% |
| Immigrants | Russia | 78.7 /100 | #148 | Good 5.0% |
| Immigrants | Oceania | 78.6 /100 | #149 | Good 5.0% |
| Brazilians | 78.3 /100 | #150 | Good 5.0% |
| Immigrants | Cameroon | 77.3 /100 | #151 | Good 5.0% |
| Albanians | 77.2 /100 | #152 | Good 5.0% |
| Immigrants | Kuwait | 76.3 /100 | #153 | Good 5.0% |
| Delaware | 73.7 /100 | #154 | Good 5.1% |
| Immigrants | Ethiopia | 72.4 /100 | #155 | Good 5.1% |
Demographics Similar to Colombians by Married-Couple Family Poverty
In terms of married-couple family poverty, the demographic groups most similar to Colombians are Panamanian (5.6%, a difference of 0.020%), Japanese (5.6%, a difference of 0.19%), Afghan (5.5%, a difference of 0.59%), Immigrants from Nigeria (5.5%, a difference of 0.61%), and Cajun (5.6%, a difference of 0.87%).
| Demographics | Rating | Rank | Married-Couple Family Poverty |
| Immigrants | Liberia | 13.3 /100 | #213 | Poor 5.5% |
| Iroquois | 13.1 /100 | #214 | Poor 5.5% |
| Armenians | 12.8 /100 | #215 | Poor 5.5% |
| Potawatomi | 12.4 /100 | #216 | Poor 5.5% |
| Immigrants | Nigeria | 11.3 /100 | #217 | Poor 5.5% |
| Afghans | 11.2 /100 | #218 | Poor 5.5% |
| Japanese | 9.8 /100 | #219 | Tragic 5.6% |
| Colombians | 9.2 /100 | #220 | Tragic 5.6% |
| Panamanians | 9.2 /100 | #221 | Tragic 5.6% |
| Cajuns | 6.9 /100 | #222 | Tragic 5.6% |
| Immigrants | Fiji | 6.7 /100 | #223 | Tragic 5.6% |
| Sudanese | 6.4 /100 | #224 | Tragic 5.6% |
| Immigrants | Cambodia | 6.1 /100 | #225 | Tragic 5.6% |
| South Americans | 5.7 /100 | #226 | Tragic 5.6% |
| Immigrants | Zaire | 5.6 /100 | #227 | Tragic 5.6% |