Immigrants from Russia vs Slavic Married-Couple Family Poverty
COMPARE
Immigrants from Russia
Slavic
Married-Couple Family Poverty
Married-Couple Family Poverty Comparison
Immigrants from Russia
Slavs
5.0%
MARRIED-COUPLE FAMILY POVERTY
78.7/ 100
METRIC RATING
148th/ 347
METRIC RANK
4.4%
MARRIED-COUPLE FAMILY POVERTY
99.4/ 100
METRIC RATING
68th/ 347
METRIC RANK
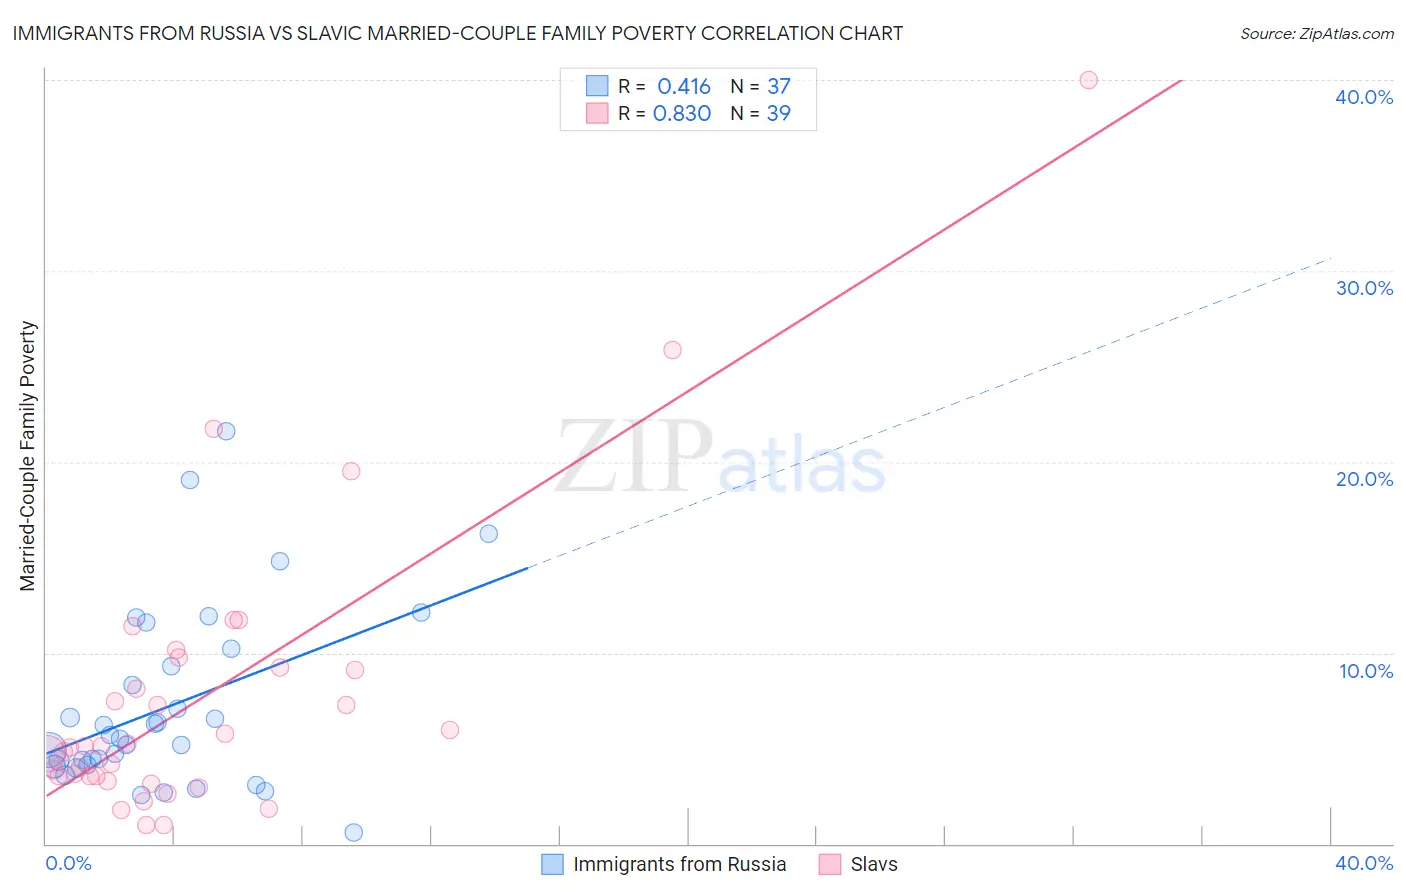
Immigrants from Russia vs Slavic Married-Couple Family Poverty Correlation Chart
The statistical analysis conducted on geographies consisting of 344,976,831 people shows a moderate positive correlation between the proportion of Immigrants from Russia and poverty level among married-couple families in the United States with a correlation coefficient (R) of 0.416 and weighted average of 5.0%. Similarly, the statistical analysis conducted on geographies consisting of 268,876,285 people shows a very strong positive correlation between the proportion of Slavs and poverty level among married-couple families in the United States with a correlation coefficient (R) of 0.830 and weighted average of 4.4%, a difference of 12.9%.
Married-Couple Family Poverty Correlation Summary
| Measurement | Immigrants from Russia | Slavic |
| Minimum | 0.60% | 0.99% |
| Maximum | 21.6% | 40.0% |
| Range | 21.0% | 39.0% |
| Mean | 7.2% | 7.6% |
| Median | 5.5% | 5.1% |
| Interquartile 25% (IQ1) | 4.1% | 3.5% |
| Interquartile 75% (IQ3) | 9.8% | 9.3% |
| Interquartile Range (IQR) | 5.7% | 5.8% |
| Standard Deviation (Sample) | 4.8% | 7.6% |
| Standard Deviation (Population) | 4.7% | 7.5% |
Similar Demographics by Married-Couple Family Poverty
Demographics Similar to Immigrants from Russia by Married-Couple Family Poverty
In terms of married-couple family poverty, the demographic groups most similar to Immigrants from Russia are Syrian (5.0%, a difference of 0.0%), Immigrants from Oceania (5.0%, a difference of 0.030%), Brazilian (5.0%, a difference of 0.080%), Mongolian (5.0%, a difference of 0.20%), and Immigrants from Spain (5.0%, a difference of 0.21%).
| Demographics | Rating | Rank | Married-Couple Family Poverty |
| Immigrants | Brazil | 84.6 /100 | #141 | Excellent 5.0% |
| Immigrants | China | 84.6 /100 | #142 | Excellent 5.0% |
| Immigrants | Egypt | 83.4 /100 | #143 | Excellent 5.0% |
| Hmong | 83.2 /100 | #144 | Excellent 5.0% |
| Immigrants | Spain | 79.9 /100 | #145 | Good 5.0% |
| Mongolians | 79.8 /100 | #146 | Good 5.0% |
| Syrians | 78.7 /100 | #147 | Good 5.0% |
| Immigrants | Russia | 78.7 /100 | #148 | Good 5.0% |
| Immigrants | Oceania | 78.6 /100 | #149 | Good 5.0% |
| Brazilians | 78.3 /100 | #150 | Good 5.0% |
| Immigrants | Cameroon | 77.3 /100 | #151 | Good 5.0% |
| Albanians | 77.2 /100 | #152 | Good 5.0% |
| Immigrants | Kuwait | 76.3 /100 | #153 | Good 5.0% |
| Delaware | 73.7 /100 | #154 | Good 5.1% |
| Immigrants | Ethiopia | 72.4 /100 | #155 | Good 5.1% |
Demographics Similar to Slavs by Married-Couple Family Poverty
In terms of married-couple family poverty, the demographic groups most similar to Slavs are Immigrants from Canada (4.4%, a difference of 0.010%), New Zealander (4.4%, a difference of 0.010%), Immigrants from Serbia (4.4%, a difference of 0.060%), Immigrants from Korea (4.5%, a difference of 0.14%), and Macedonian (4.4%, a difference of 0.19%).
| Demographics | Rating | Rank | Married-Couple Family Poverty |
| Okinawans | 99.6 /100 | #61 | Exceptional 4.4% |
| Immigrants | Australia | 99.6 /100 | #62 | Exceptional 4.4% |
| Immigrants | Sri Lanka | 99.6 /100 | #63 | Exceptional 4.4% |
| Immigrants | Bulgaria | 99.5 /100 | #64 | Exceptional 4.4% |
| Macedonians | 99.4 /100 | #65 | Exceptional 4.4% |
| Immigrants | Serbia | 99.4 /100 | #66 | Exceptional 4.4% |
| Immigrants | Canada | 99.4 /100 | #67 | Exceptional 4.4% |
| Slavs | 99.4 /100 | #68 | Exceptional 4.4% |
| New Zealanders | 99.4 /100 | #69 | Exceptional 4.4% |
| Immigrants | Korea | 99.4 /100 | #70 | Exceptional 4.5% |
| Immigrants | North America | 99.3 /100 | #71 | Exceptional 4.5% |
| Immigrants | England | 99.3 /100 | #72 | Exceptional 4.5% |
| Ukrainians | 99.2 /100 | #73 | Exceptional 4.5% |
| Immigrants | Austria | 99.2 /100 | #74 | Exceptional 4.5% |
| Cambodians | 99.2 /100 | #75 | Exceptional 4.5% |