Immigrants from Oceania vs Norwegian Female Poverty Among 25-34 Year Olds
COMPARE
Immigrants from Oceania
Norwegian
Female Poverty Among 25-34 Year Olds
Female Poverty Among 25-34 Year Olds Comparison
Immigrants from Oceania
Norwegians
13.5%
FEMALE POVERTY AMONG 25-34 YEAR OLDS
50.0/ 100
METRIC RATING
174th/ 347
METRIC RANK
12.6%
FEMALE POVERTY AMONG 25-34 YEAR OLDS
96.9/ 100
METRIC RATING
91st/ 347
METRIC RANK
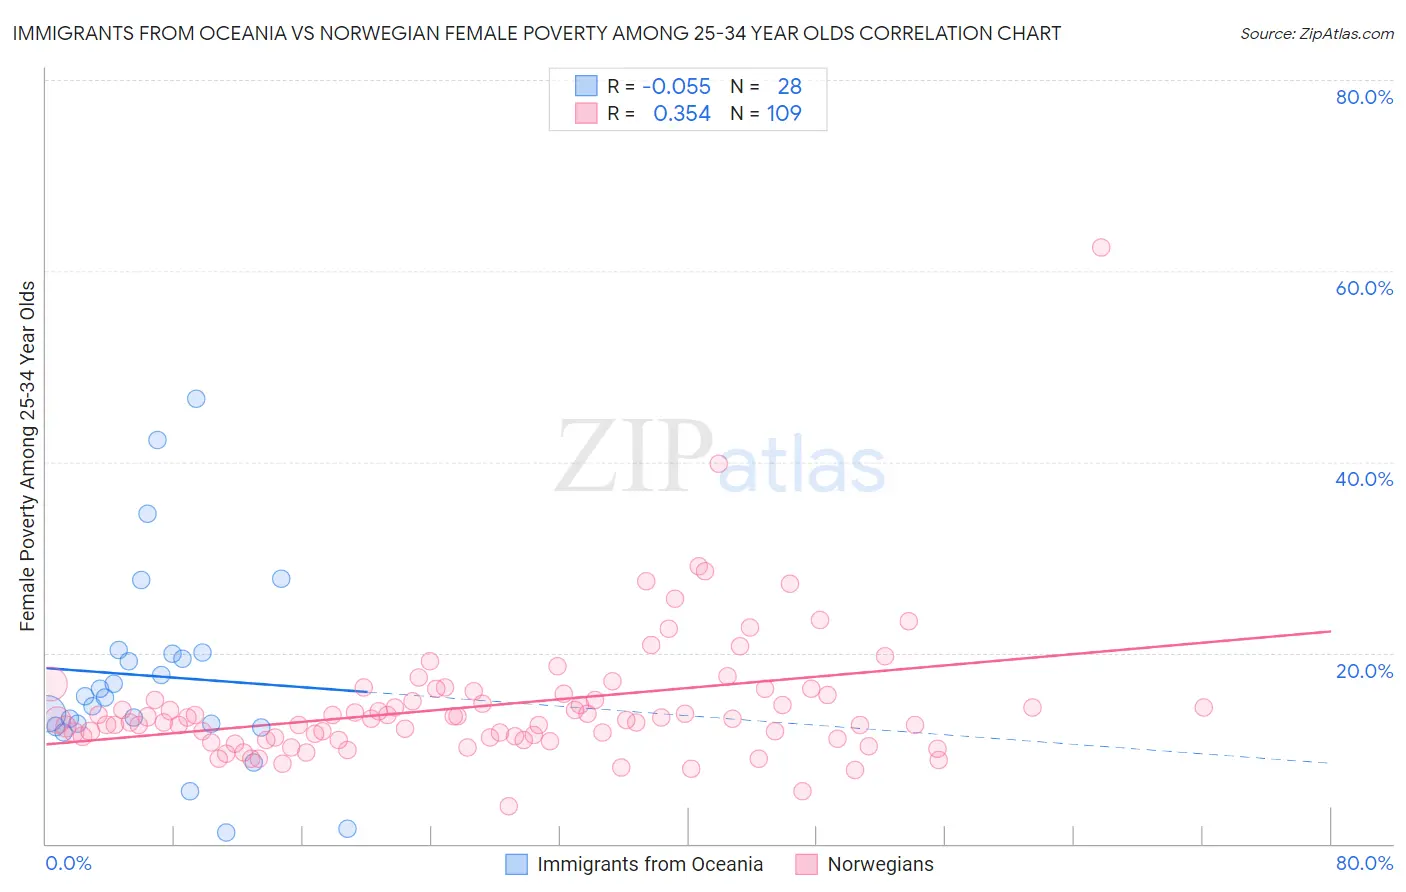
Immigrants from Oceania vs Norwegian Female Poverty Among 25-34 Year Olds Correlation Chart
The statistical analysis conducted on geographies consisting of 301,478,859 people shows a slight negative correlation between the proportion of Immigrants from Oceania and poverty level among females between the ages 25 and 34 in the United States with a correlation coefficient (R) of -0.055 and weighted average of 13.5%. Similarly, the statistical analysis conducted on geographies consisting of 515,286,681 people shows a mild positive correlation between the proportion of Norwegians and poverty level among females between the ages 25 and 34 in the United States with a correlation coefficient (R) of 0.354 and weighted average of 12.6%, a difference of 7.7%.
Female Poverty Among 25-34 Year Olds Correlation Summary
| Measurement | Immigrants from Oceania | Norwegian |
| Minimum | 1.2% | 3.9% |
| Maximum | 46.7% | 62.5% |
| Range | 45.4% | 58.6% |
| Mean | 17.6% | 14.5% |
| Median | 15.4% | 13.1% |
| Interquartile 25% (IQ1) | 12.4% | 11.2% |
| Interquartile 75% (IQ3) | 19.9% | 15.7% |
| Interquartile Range (IQR) | 7.5% | 4.5% |
| Standard Deviation (Sample) | 10.5% | 7.0% |
| Standard Deviation (Population) | 10.3% | 7.0% |
Similar Demographics by Female Poverty Among 25-34 Year Olds
Demographics Similar to Immigrants from Oceania by Female Poverty Among 25-34 Year Olds
In terms of female poverty among 25-34 year olds, the demographic groups most similar to Immigrants from Oceania are Kenyan (13.5%, a difference of 0.15%), South American Indian (13.5%, a difference of 0.16%), Immigrants from Costa Rica (13.5%, a difference of 0.16%), Immigrants from Uganda (13.5%, a difference of 0.25%), and Bermudan (13.6%, a difference of 0.26%).
| Demographics | Rating | Rank | Female Poverty Among 25-34 Year Olds |
| Immigrants | Bosnia and Herzegovina | 58.6 /100 | #167 | Average 13.4% |
| Immigrants | Afghanistan | 57.7 /100 | #168 | Average 13.4% |
| Samoans | 56.8 /100 | #169 | Average 13.5% |
| Immigrants | Uganda | 53.0 /100 | #170 | Average 13.5% |
| South American Indians | 51.9 /100 | #171 | Average 13.5% |
| Immigrants | Costa Rica | 51.9 /100 | #172 | Average 13.5% |
| Kenyans | 51.8 /100 | #173 | Average 13.5% |
| Immigrants | Oceania | 50.0 /100 | #174 | Average 13.5% |
| Bermudans | 46.8 /100 | #175 | Average 13.6% |
| Yugoslavians | 45.0 /100 | #176 | Average 13.6% |
| Venezuelans | 44.6 /100 | #177 | Average 13.6% |
| Canadians | 44.3 /100 | #178 | Average 13.6% |
| Immigrants | Eastern Africa | 43.6 /100 | #179 | Average 13.6% |
| Germans | 41.6 /100 | #180 | Average 13.6% |
| Guamanians/Chamorros | 41.5 /100 | #181 | Average 13.6% |
Demographics Similar to Norwegians by Female Poverty Among 25-34 Year Olds
In terms of female poverty among 25-34 year olds, the demographic groups most similar to Norwegians are Immigrants from Armenia (12.6%, a difference of 0.010%), Palestinian (12.6%, a difference of 0.050%), Immigrants from Albania (12.5%, a difference of 0.10%), Immigrants from France (12.6%, a difference of 0.10%), and Ukrainian (12.6%, a difference of 0.13%).
| Demographics | Rating | Rank | Female Poverty Among 25-34 Year Olds |
| Immigrants | Latvia | 97.7 /100 | #84 | Exceptional 12.5% |
| Immigrants | South Eastern Asia | 97.6 /100 | #85 | Exceptional 12.5% |
| Croatians | 97.5 /100 | #86 | Exceptional 12.5% |
| Argentineans | 97.5 /100 | #87 | Exceptional 12.5% |
| Immigrants | Austria | 97.4 /100 | #88 | Exceptional 12.5% |
| Italians | 97.2 /100 | #89 | Exceptional 12.5% |
| Immigrants | Albania | 97.1 /100 | #90 | Exceptional 12.5% |
| Norwegians | 96.9 /100 | #91 | Exceptional 12.6% |
| Immigrants | Armenia | 96.9 /100 | #92 | Exceptional 12.6% |
| Palestinians | 96.9 /100 | #93 | Exceptional 12.6% |
| Immigrants | France | 96.8 /100 | #94 | Exceptional 12.6% |
| Ukrainians | 96.7 /100 | #95 | Exceptional 12.6% |
| Immigrants | Zimbabwe | 96.7 /100 | #96 | Exceptional 12.6% |
| Immigrants | Northern Africa | 96.6 /100 | #97 | Exceptional 12.6% |
| Immigrants | Ethiopia | 96.5 /100 | #98 | Exceptional 12.6% |