Immigrants from Ireland vs Norwegian Female Poverty Among 25-34 Year Olds

COMPARE

Immigrants from Ireland
Race
Ancestry
AfghanAfricanAlaska NativeAlaskan AthabascanAlbanianAleutAlsatianAmericanApacheArabArapahoArgentineanArmenianAssyrian/Chaldean/SyriacAustralianAustrianBahamianBangladeshiBarbadianBasqueBelgianBelizeanBermudanBhutaneseBlackfeetBolivianBrazilianBritishBritish West IndianBulgarianBurmeseCajunCambodianCanadianCape VerdeanCarpatho RusynCelticCentral AmericanCentral American IndianCherokeeCheyenneChickasawChileanChineseChippewaChoctawColombianColvilleComancheCosta RicanCreeCreekCroatianCrowCubanCypriotCzechCzechoslovakianDanishDelawareDominicanDutchDutch West IndianEastern EuropeanEcuadorianEgyptianEnglishEstonianEthiopianEuropeanFijianFilipinoFinnishFrenchFrench American IndianFrench CanadianGermanGerman RussianGhanaianGreekGuamanian/ChamorroGuatemalanGuyaneseHaitianHmongHonduranHopiHoumaHungarianIcelanderIndian (Asian)IndonesianInupiatIranianIraqiIrishIroquoisIsraeliItalianJamaicanJapaneseJordanianKenyanKiowaKoreanLaotianLatvianLebaneseLiberianLithuanianLumbeeLuxembourgerMacedonianMalaysianMalteseMarshalleseMenomineeMexicanMexican American IndianMongolianMoroccanNative HawaiianNavajoNepaleseNew ZealanderNicaraguanNigerianNorthern EuropeanOkinawanOsageOttawaPaiutePakistaniPalestinianPanamanianParaguayanPennsylvania GermanPeruvianPimaPolishPortuguesePotawatomiPuebloPuerto RicanPuget Sound SalishRomanianRussianSalvadoranSamoanScandinavianScotch-IrishScottishSeminoleSenegaleseSerbianShoshoneSierra LeoneanSiouxSlavicSlovakSloveneSomaliSouth AfricanSouth AmericanSouth American IndianSoviet UnionSpaniardSpanishSpanish AmericanSpanish American IndianSri LankanSubsaharan AfricanSudaneseSwedishSwissSyrianTaiwaneseThaiTlingit-HaidaTohono O'OdhamTonganTrinidadian and TobagonianTsimshianTurkishU.S. Virgin IslanderUgandanUkrainianUruguayanUteVenezuelanVietnameseWelshWest IndianYakamaYaquiYugoslavianYumanYup'ikZimbabwean
Immigration
NonimmigrantsImmigrantsAfghanistanAfricaAlbaniaArgentinaArmeniaAsiaAustraliaAustriaBahamasBangladeshBarbadosBelarusBelgiumBelizeBoliviaBosnia and HerzegovinaBrazilBulgariaBurma/MyanmarCabo VerdeCambodiaCameroonCanadaCaribbeanCentral AmericaChileChinaColombiaCongoCosta RicaCroatiaCubaCzechoslovakiaDenmarkDominicaDominican RepublicEastern AfricaEastern AsiaEastern EuropeEcuadorEgyptEl SalvadorEnglandEritreaEthiopiaEuropeFijiFranceGermanyGhanaGreeceGrenadaGuatemalaGuyanaHaitiHondurasHong KongHungaryIndiaIndonesiaIranIraqIrelandIsraelItalyJamaicaJapanJordanKazakhstanKenyaKoreaKuwaitLaosLatin AmericaLatviaLebanonLiberiaLithuaniaMalaysiaMexicoMicronesiaMiddle AfricaMoldovaMoroccoNepalNetherlandsNicaraguaNigeriaNorth AmericaNorth MacedoniaNorthern AfricaNorthern EuropeNorwayOceaniaPakistanPanamaPeruPhilippinesPolandPortugalRomaniaRussiaSaudi ArabiaScotlandSenegalSerbiaSierra LeoneSingaporeSomaliaSouth AfricaSouth AmericaSouth Central AsiaSouth Eastern AsiaSouthern EuropeSpainSri LankaSt. Vincent and the GrenadinesSudanSwedenSwitzerlandSyriaTaiwanThailandTrinidad and TobagoTurkeyUgandaUkraineUruguayUzbekistanVenezuelaVietnamWest IndiesWestern AfricaWestern AsiaWestern EuropeYemenZaireZimbabweAzores
Norwegian
Race
Ancestry
AfghanAfricanAlaska NativeAlaskan AthabascanAlbanianAleutAlsatianAmericanApacheArabArapahoArgentineanArmenianAssyrian/Chaldean/SyriacAustralianAustrianBahamianBangladeshiBarbadianBasqueBelgianBelizeanBermudanBhutaneseBlackfeetBolivianBrazilianBritishBritish West IndianBulgarianBurmeseCajunCambodianCanadianCape VerdeanCarpatho RusynCelticCentral AmericanCentral American IndianCherokeeCheyenneChickasawChileanChineseChippewaChoctawColombianColvilleComancheCosta RicanCreeCreekCroatianCrowCubanCypriotCzechCzechoslovakianDanishDelawareDominicanDutchDutch West IndianEastern EuropeanEcuadorianEgyptianEnglishEstonianEthiopianEuropeanFijianFilipinoFinnishFrenchFrench American IndianFrench CanadianGermanGerman RussianGhanaianGreekGuamanian/ChamorroGuatemalanGuyaneseHaitianHmongHonduranHopiHoumaHungarianIcelanderIndian (Asian)IndonesianInupiatIranianIraqiIrishIroquoisIsraeliItalianJamaicanJapaneseJordanianKenyanKiowaKoreanLaotianLatvianLebaneseLiberianLithuanianLumbeeLuxembourgerMacedonianMalaysianMalteseMarshalleseMenomineeMexicanMexican American IndianMongolianMoroccanNative HawaiianNavajoNepaleseNew ZealanderNicaraguanNigerianNorthern EuropeanNorwegianOkinawanOsageOttawaPaiutePakistaniPalestinianPanamanianParaguayanPennsylvania GermanPeruvianPimaPolishPortuguesePotawatomiPuebloPuerto RicanPuget Sound SalishRomanianRussianSalvadoranSamoanScandinavianScotch-IrishScottishSeminoleSenegaleseSerbianShoshoneSierra LeoneanSiouxSlavicSlovakSloveneSomaliSouth AfricanSouth AmericanSouth American IndianSoviet UnionSpaniardSpanishSpanish AmericanSpanish American IndianSri LankanSubsaharan AfricanSudaneseSwedishSwissSyrianTaiwaneseThaiTlingit-HaidaTohono O'OdhamTonganTrinidadian and TobagonianTsimshianTurkishU.S. Virgin IslanderUgandanUkrainianUruguayanUteVenezuelanVietnameseWelshWest IndianYakamaYaquiYugoslavianYumanYup'ikZimbabwean
Immigration
NonimmigrantsImmigrantsAfghanistanAfricaAlbaniaArgentinaArmeniaAsiaAustraliaAustriaBahamasBangladeshBarbadosBelarusBelgiumBelizeBoliviaBosnia and HerzegovinaBrazilBulgariaBurma/MyanmarCabo VerdeCambodiaCameroonCanadaCaribbeanCentral AmericaChileChinaColombiaCongoCosta RicaCroatiaCubaCzechoslovakiaDenmarkDominicaDominican RepublicEastern AfricaEastern AsiaEastern EuropeEcuadorEgyptEl SalvadorEnglandEritreaEthiopiaEuropeFijiFranceGermanyGhanaGreeceGrenadaGuatemalaGuyanaHaitiHondurasHong KongHungaryIndiaIndonesiaIranIraqIsraelItalyJamaicaJapanJordanKazakhstanKenyaKoreaKuwaitLaosLatin AmericaLatviaLebanonLiberiaLithuaniaMalaysiaMexicoMicronesiaMiddle AfricaMoldovaMoroccoNepalNetherlandsNicaraguaNigeriaNorth AmericaNorth MacedoniaNorthern AfricaNorthern EuropeNorwayOceaniaPakistanPanamaPeruPhilippinesPolandPortugalRomaniaRussiaSaudi ArabiaScotlandSenegalSerbiaSierra LeoneSingaporeSomaliaSouth AfricaSouth AmericaSouth Central AsiaSouth Eastern AsiaSouthern EuropeSpainSri LankaSt. Vincent and the GrenadinesSudanSwedenSwitzerlandSyriaTaiwanThailandTrinidad and TobagoTurkeyUgandaUkraineUruguayUzbekistanVenezuelaVietnamWest IndiesWestern AfricaWestern AsiaWestern EuropeYemenZaireZimbabweAzores
Female Poverty Among 25-34 Year Olds
Income
Poverty
Unemployment
Labor Participation
Family Structure
Vehicle Availability
Education Level
Disability

Female Poverty Among 25-34 Year Olds Comparison

Immigrants from Ireland

Norwegians

Exceptional
Exceptional
11.2%
FEMALE POVERTY AMONG 25-34 YEAR OLDS
100.0/ 100
METRIC RATING
12th/ 347
METRIC RANK
12.6%
FEMALE POVERTY AMONG 25-34 YEAR OLDS
96.9/ 100
METRIC RATING
91st/ 347
METRIC RANK

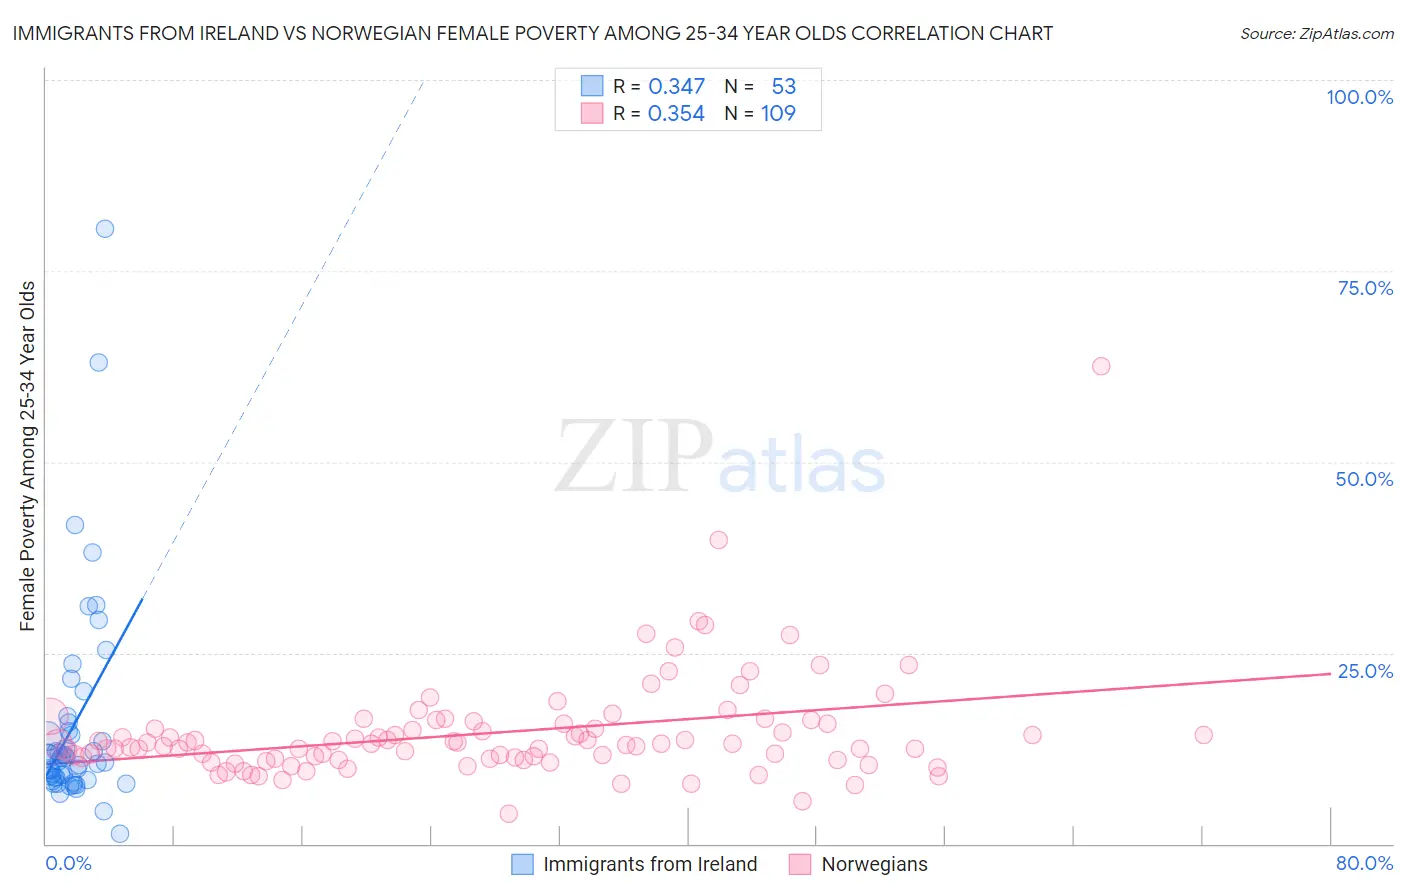
Immigrants from Ireland vs Norwegian Female Poverty Among 25-34 Year Olds Correlation Chart

The statistical analysis conducted on geographies consisting of 237,059,494 people shows a mild positive correlation between the proportion of Immigrants from Ireland and poverty level among females between the ages 25 and 34 in the United States with a correlation coefficient (R) of 0.347 and weighted average of 11.2%. Similarly, the statistical analysis conducted on geographies consisting of 515,286,681 people shows a mild positive correlation between the proportion of Norwegians and poverty level among females between the ages 25 and 34 in the United States with a correlation coefficient (R) of 0.354 and weighted average of 12.6%, a difference of 12.6%.
Immigrants from Ireland vs Norwegian Female Poverty Among 25-34 Year Olds

Female Poverty Among 25-34 Year Olds Correlation Summary

MeasurementImmigrants from IrelandNorwegian
Minimum1.4%3.9%
Maximum80.5%62.5%
Range79.1%58.6%
Mean15.6%14.5%
Median11.3%13.1%
Interquartile 25% (IQ1)8.5%11.2%
Interquartile 75% (IQ3)15.4%15.7%
Interquartile Range (IQR)6.9%4.5%
Standard Deviation (Sample)14.0%7.0%
Standard Deviation (Population)13.9%7.0%

Similar Demographics by Female Poverty Among 25-34 Year Olds

Demographics Similar to Immigrants from Ireland by Female Poverty Among 25-34 Year Olds

In terms of female poverty among 25-34 year olds, the demographic groups most similar to Immigrants from Ireland are Burmese (11.2%, a difference of 0.11%), Indian (Asian) (11.2%, a difference of 0.11%), Immigrants from Korea (11.1%, a difference of 0.13%), Assyrian/Chaldean/Syriac (11.2%, a difference of 0.22%), and Immigrants from Bolivia (11.2%, a difference of 0.26%).
DemographicsRating | RankFemale Poverty Among 25-34 Year Olds
Immigrants | Hong Kong
100.0
/100
|
#5
Exceptional
10.4%
Immigrants | South Central Asia
100.0
/100
|
#6
Exceptional
10.8%
Chinese
100.0
/100
|
#7
Exceptional
11.0%
Immigrants | Iran
100.0
/100
|
#8
Exceptional
11.0%
Immigrants | Singapore
100.0
/100
|
#9
Exceptional
11.1%
Immigrants | Lithuania
100.0
/100
|
#10
Exceptional
11.1%
Immigrants | Korea
100.0
/100
|
#11
Exceptional
11.1%
Immigrants | Ireland
100.0
/100
|
#12
Exceptional
11.2%
Burmese
100.0
/100
|
#13
Exceptional
11.2%
Indians (Asian)
100.0
/100
|
#14
Exceptional
11.2%
Assyrians/Chaldeans/Syriacs
100.0
/100
|
#15
Exceptional
11.2%
Immigrants | Bolivia
100.0
/100
|
#16
Exceptional
11.2%
Immigrants | China
100.0
/100
|
#17
Exceptional
11.2%
Immigrants | Eastern Asia
100.0
/100
|
#18
Exceptional
11.2%
Iranians
100.0
/100
|
#19
Exceptional
11.2%

Demographics Similar to Norwegians by Female Poverty Among 25-34 Year Olds

In terms of female poverty among 25-34 year olds, the demographic groups most similar to Norwegians are Immigrants from Armenia (12.6%, a difference of 0.010%), Palestinian (12.6%, a difference of 0.050%), Immigrants from Albania (12.5%, a difference of 0.10%), Immigrants from France (12.6%, a difference of 0.10%), and Ukrainian (12.6%, a difference of 0.13%).
DemographicsRating | RankFemale Poverty Among 25-34 Year Olds
Immigrants | Latvia
97.7
/100
|
#84
Exceptional
12.5%
Immigrants | South Eastern Asia
97.6
/100
|
#85
Exceptional
12.5%
Croatians
97.5
/100
|
#86
Exceptional
12.5%
Argentineans
97.5
/100
|
#87
Exceptional
12.5%
Immigrants | Austria
97.4
/100
|
#88
Exceptional
12.5%
Italians
97.2
/100
|
#89
Exceptional
12.5%
Immigrants | Albania
97.1
/100
|
#90
Exceptional
12.5%
Norwegians
96.9
/100
|
#91
Exceptional
12.6%
Immigrants | Armenia
96.9
/100
|
#92
Exceptional
12.6%
Palestinians
96.9
/100
|
#93
Exceptional
12.6%
Immigrants | France
96.8
/100
|
#94
Exceptional
12.6%
Ukrainians
96.7
/100
|
#95
Exceptional
12.6%
Immigrants | Zimbabwe
96.7
/100
|
#96
Exceptional
12.6%
Immigrants | Northern Africa
96.6
/100
|
#97
Exceptional
12.6%
Immigrants | Ethiopia
96.5
/100
|
#98
Exceptional
12.6%