Immigrants from Oceania vs Austrian Female Poverty Among 25-34 Year Olds
COMPARE
Immigrants from Oceania
Austrian
Female Poverty Among 25-34 Year Olds
Female Poverty Among 25-34 Year Olds Comparison
Immigrants from Oceania
Austrians
13.5%
FEMALE POVERTY AMONG 25-34 YEAR OLDS
50.0/ 100
METRIC RATING
174th/ 347
METRIC RANK
13.1%
FEMALE POVERTY AMONG 25-34 YEAR OLDS
83.7/ 100
METRIC RATING
139th/ 347
METRIC RANK
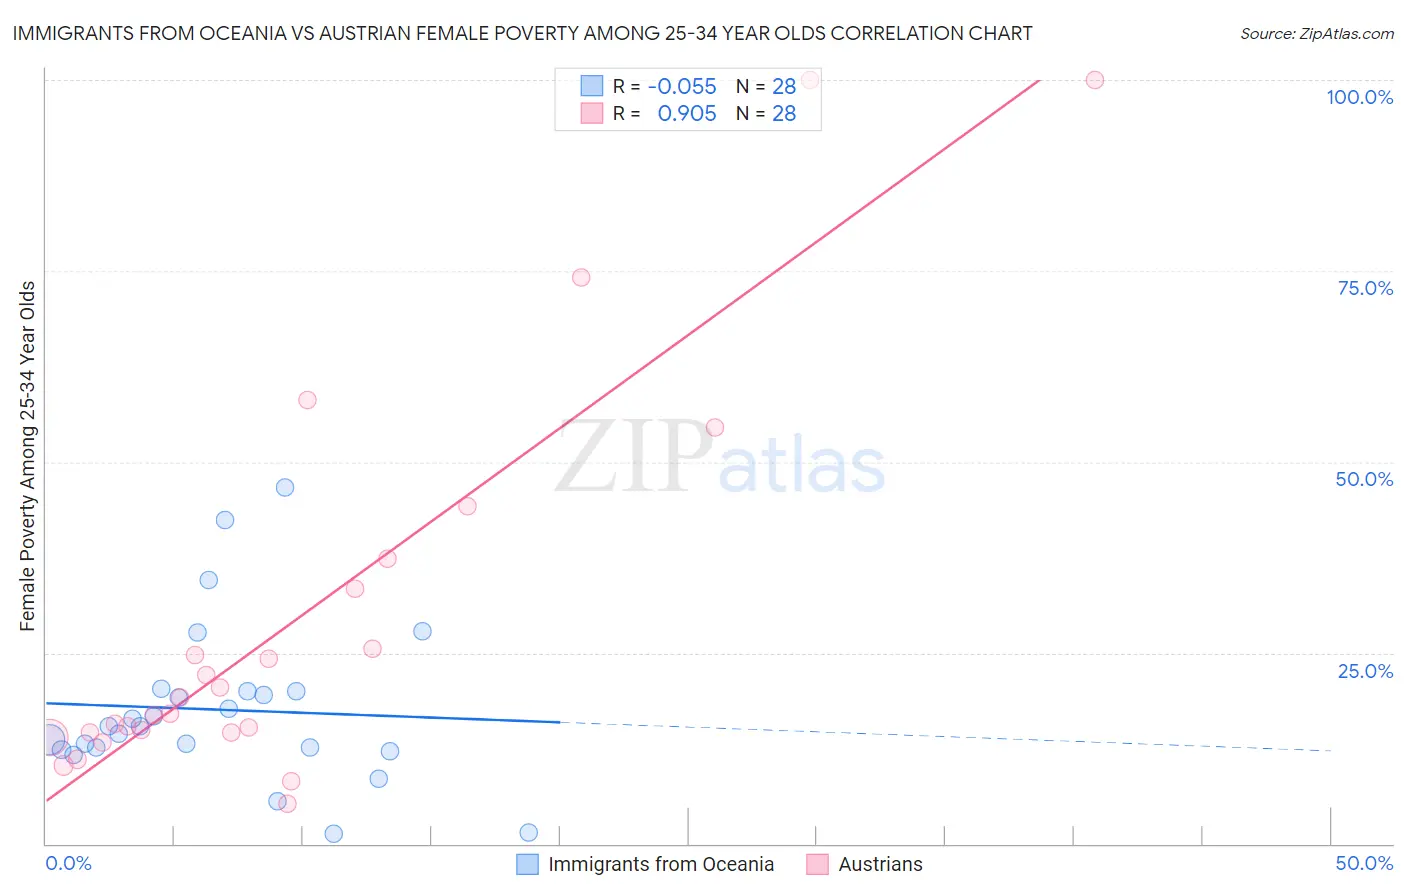
Immigrants from Oceania vs Austrian Female Poverty Among 25-34 Year Olds Correlation Chart
The statistical analysis conducted on geographies consisting of 301,478,859 people shows a slight negative correlation between the proportion of Immigrants from Oceania and poverty level among females between the ages 25 and 34 in the United States with a correlation coefficient (R) of -0.055 and weighted average of 13.5%. Similarly, the statistical analysis conducted on geographies consisting of 440,453,770 people shows a near-perfect positive correlation between the proportion of Austrians and poverty level among females between the ages 25 and 34 in the United States with a correlation coefficient (R) of 0.905 and weighted average of 13.1%, a difference of 3.5%.
Female Poverty Among 25-34 Year Olds Correlation Summary
| Measurement | Immigrants from Oceania | Austrian |
| Minimum | 1.2% | 5.2% |
| Maximum | 46.7% | 100.0% |
| Range | 45.4% | 94.8% |
| Mean | 17.6% | 29.4% |
| Median | 15.4% | 18.0% |
| Interquartile 25% (IQ1) | 12.4% | 14.6% |
| Interquartile 75% (IQ3) | 19.9% | 35.3% |
| Interquartile Range (IQR) | 7.5% | 20.7% |
| Standard Deviation (Sample) | 10.5% | 25.7% |
| Standard Deviation (Population) | 10.3% | 25.2% |
Similar Demographics by Female Poverty Among 25-34 Year Olds
Demographics Similar to Immigrants from Oceania by Female Poverty Among 25-34 Year Olds
In terms of female poverty among 25-34 year olds, the demographic groups most similar to Immigrants from Oceania are Kenyan (13.5%, a difference of 0.15%), South American Indian (13.5%, a difference of 0.16%), Immigrants from Costa Rica (13.5%, a difference of 0.16%), Immigrants from Uganda (13.5%, a difference of 0.25%), and Bermudan (13.6%, a difference of 0.26%).
| Demographics | Rating | Rank | Female Poverty Among 25-34 Year Olds |
| Immigrants | Bosnia and Herzegovina | 58.6 /100 | #167 | Average 13.4% |
| Immigrants | Afghanistan | 57.7 /100 | #168 | Average 13.4% |
| Samoans | 56.8 /100 | #169 | Average 13.5% |
| Immigrants | Uganda | 53.0 /100 | #170 | Average 13.5% |
| South American Indians | 51.9 /100 | #171 | Average 13.5% |
| Immigrants | Costa Rica | 51.9 /100 | #172 | Average 13.5% |
| Kenyans | 51.8 /100 | #173 | Average 13.5% |
| Immigrants | Oceania | 50.0 /100 | #174 | Average 13.5% |
| Bermudans | 46.8 /100 | #175 | Average 13.6% |
| Yugoslavians | 45.0 /100 | #176 | Average 13.6% |
| Venezuelans | 44.6 /100 | #177 | Average 13.6% |
| Canadians | 44.3 /100 | #178 | Average 13.6% |
| Immigrants | Eastern Africa | 43.6 /100 | #179 | Average 13.6% |
| Germans | 41.6 /100 | #180 | Average 13.6% |
| Guamanians/Chamorros | 41.5 /100 | #181 | Average 13.6% |
Demographics Similar to Austrians by Female Poverty Among 25-34 Year Olds
In terms of female poverty among 25-34 year olds, the demographic groups most similar to Austrians are Immigrants from Iraq (13.1%, a difference of 0.020%), New Zealander (13.1%, a difference of 0.060%), Brazilian (13.1%, a difference of 0.13%), Immigrants from Chile (13.1%, a difference of 0.14%), and Scandinavian (13.1%, a difference of 0.21%).
| Demographics | Rating | Rank | Female Poverty Among 25-34 Year Olds |
| Immigrants | Hungary | 88.3 /100 | #132 | Excellent 13.0% |
| Serbians | 87.6 /100 | #133 | Excellent 13.0% |
| Afghans | 85.8 /100 | #134 | Excellent 13.0% |
| South Africans | 85.7 /100 | #135 | Excellent 13.0% |
| Immigrants | England | 85.5 /100 | #136 | Excellent 13.0% |
| Immigrants | Chile | 84.6 /100 | #137 | Excellent 13.1% |
| Brazilians | 84.5 /100 | #138 | Excellent 13.1% |
| Austrians | 83.7 /100 | #139 | Excellent 13.1% |
| Immigrants | Iraq | 83.6 /100 | #140 | Excellent 13.1% |
| New Zealanders | 83.4 /100 | #141 | Excellent 13.1% |
| Scandinavians | 82.3 /100 | #142 | Excellent 13.1% |
| Israelis | 81.9 /100 | #143 | Excellent 13.1% |
| Native Hawaiians | 78.9 /100 | #144 | Good 13.2% |
| Colombians | 77.2 /100 | #145 | Good 13.2% |
| South Americans | 76.9 /100 | #146 | Good 13.2% |