Immigrants from Oceania vs Immigrants from Grenada Female Poverty Among 25-34 Year Olds
COMPARE
Immigrants from Oceania
Immigrants from Grenada
Female Poverty Among 25-34 Year Olds
Female Poverty Among 25-34 Year Olds Comparison
Immigrants from Oceania
Immigrants from Grenada
13.5%
FEMALE POVERTY AMONG 25-34 YEAR OLDS
50.0/ 100
METRIC RATING
174th/ 347
METRIC RANK
14.7%
FEMALE POVERTY AMONG 25-34 YEAR OLDS
1.3/ 100
METRIC RATING
240th/ 347
METRIC RANK
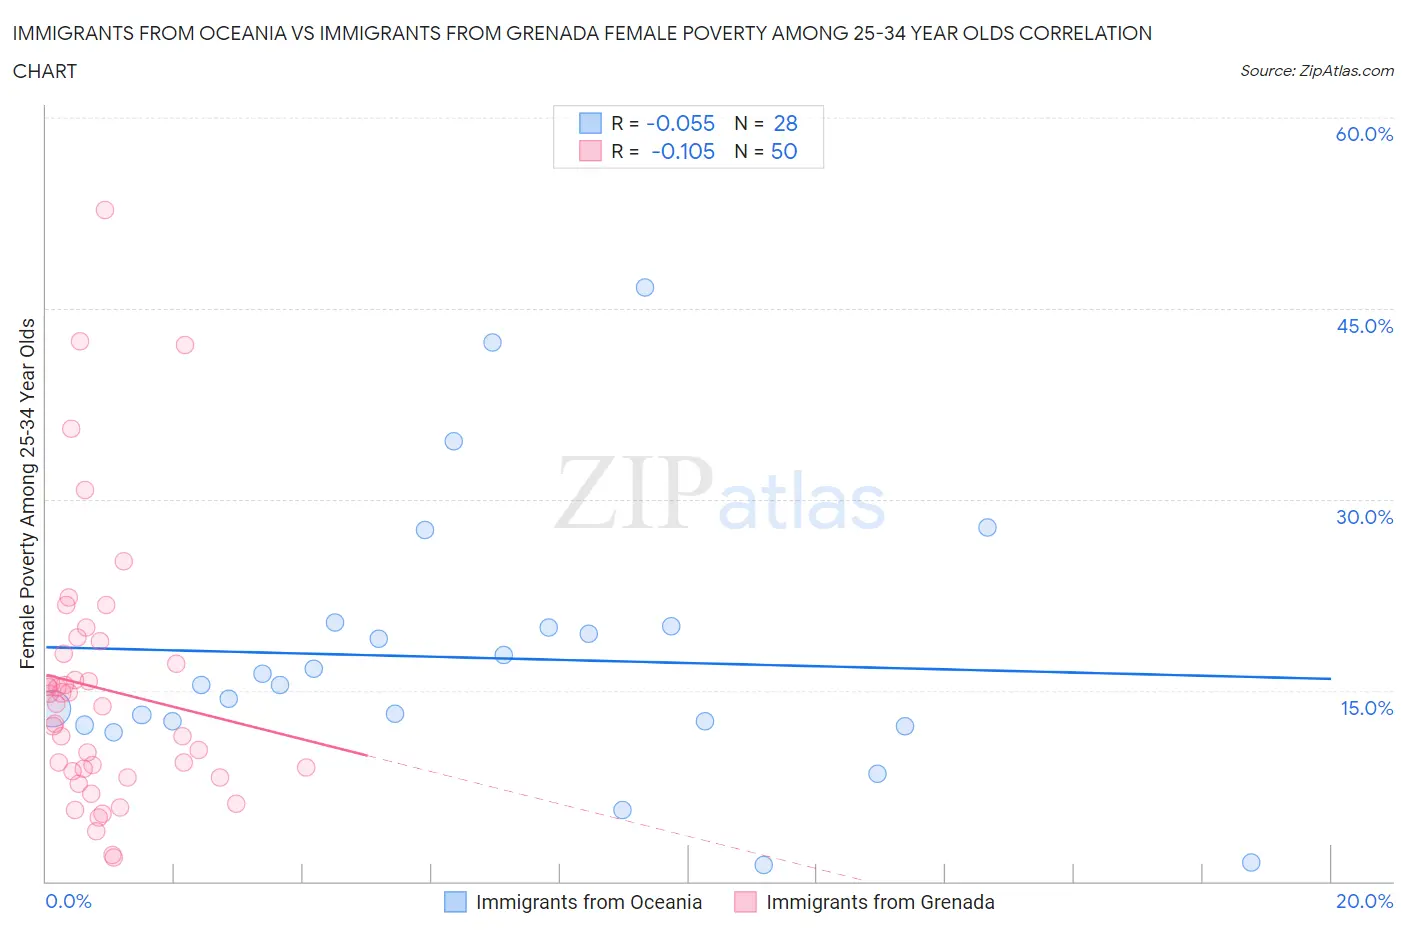
Immigrants from Oceania vs Immigrants from Grenada Female Poverty Among 25-34 Year Olds Correlation Chart
The statistical analysis conducted on geographies consisting of 301,478,859 people shows a slight negative correlation between the proportion of Immigrants from Oceania and poverty level among females between the ages 25 and 34 in the United States with a correlation coefficient (R) of -0.055 and weighted average of 13.5%. Similarly, the statistical analysis conducted on geographies consisting of 67,009,327 people shows a poor negative correlation between the proportion of Immigrants from Grenada and poverty level among females between the ages 25 and 34 in the United States with a correlation coefficient (R) of -0.105 and weighted average of 14.7%, a difference of 9.0%.
Female Poverty Among 25-34 Year Olds Correlation Summary
| Measurement | Immigrants from Oceania | Immigrants from Grenada |
| Minimum | 1.2% | 1.9% |
| Maximum | 46.7% | 52.7% |
| Range | 45.4% | 50.8% |
| Mean | 17.6% | 15.1% |
| Median | 15.4% | 13.8% |
| Interquartile 25% (IQ1) | 12.4% | 8.6% |
| Interquartile 75% (IQ3) | 19.9% | 17.9% |
| Interquartile Range (IQR) | 7.5% | 9.3% |
| Standard Deviation (Sample) | 10.5% | 10.4% |
| Standard Deviation (Population) | 10.3% | 10.3% |
Similar Demographics by Female Poverty Among 25-34 Year Olds
Demographics Similar to Immigrants from Oceania by Female Poverty Among 25-34 Year Olds
In terms of female poverty among 25-34 year olds, the demographic groups most similar to Immigrants from Oceania are Kenyan (13.5%, a difference of 0.15%), South American Indian (13.5%, a difference of 0.16%), Immigrants from Costa Rica (13.5%, a difference of 0.16%), Immigrants from Uganda (13.5%, a difference of 0.25%), and Bermudan (13.6%, a difference of 0.26%).
| Demographics | Rating | Rank | Female Poverty Among 25-34 Year Olds |
| Immigrants | Bosnia and Herzegovina | 58.6 /100 | #167 | Average 13.4% |
| Immigrants | Afghanistan | 57.7 /100 | #168 | Average 13.4% |
| Samoans | 56.8 /100 | #169 | Average 13.5% |
| Immigrants | Uganda | 53.0 /100 | #170 | Average 13.5% |
| South American Indians | 51.9 /100 | #171 | Average 13.5% |
| Immigrants | Costa Rica | 51.9 /100 | #172 | Average 13.5% |
| Kenyans | 51.8 /100 | #173 | Average 13.5% |
| Immigrants | Oceania | 50.0 /100 | #174 | Average 13.5% |
| Bermudans | 46.8 /100 | #175 | Average 13.6% |
| Yugoslavians | 45.0 /100 | #176 | Average 13.6% |
| Venezuelans | 44.6 /100 | #177 | Average 13.6% |
| Canadians | 44.3 /100 | #178 | Average 13.6% |
| Immigrants | Eastern Africa | 43.6 /100 | #179 | Average 13.6% |
| Germans | 41.6 /100 | #180 | Average 13.6% |
| Guamanians/Chamorros | 41.5 /100 | #181 | Average 13.6% |
Demographics Similar to Immigrants from Grenada by Female Poverty Among 25-34 Year Olds
In terms of female poverty among 25-34 year olds, the demographic groups most similar to Immigrants from Grenada are Malaysian (14.7%, a difference of 0.050%), Alsatian (14.7%, a difference of 0.080%), Salvadoran (14.7%, a difference of 0.12%), Immigrants from Ghana (14.7%, a difference of 0.12%), and Immigrants from Jamaica (14.7%, a difference of 0.14%).
| Demographics | Rating | Rank | Female Poverty Among 25-34 Year Olds |
| Whites/Caucasians | 1.8 /100 | #233 | Tragic 14.7% |
| Cubans | 1.6 /100 | #234 | Tragic 14.7% |
| Immigrants | Jamaica | 1.4 /100 | #235 | Tragic 14.7% |
| Salvadorans | 1.4 /100 | #236 | Tragic 14.7% |
| Immigrants | Ghana | 1.4 /100 | #237 | Tragic 14.7% |
| Alsatians | 1.4 /100 | #238 | Tragic 14.7% |
| Malaysians | 1.4 /100 | #239 | Tragic 14.7% |
| Immigrants | Grenada | 1.3 /100 | #240 | Tragic 14.7% |
| Scotch-Irish | 1.2 /100 | #241 | Tragic 14.8% |
| Barbadians | 1.2 /100 | #242 | Tragic 14.8% |
| Immigrants | Nicaragua | 1.1 /100 | #243 | Tragic 14.8% |
| Immigrants | Bangladesh | 1.1 /100 | #244 | Tragic 14.8% |
| Immigrants | Middle Africa | 1.0 /100 | #245 | Tragic 14.8% |
| Jamaicans | 1.0 /100 | #246 | Tragic 14.8% |
| German Russians | 0.8 /100 | #247 | Tragic 14.9% |