Immigrants from Iraq vs Iroquois Family Poverty
COMPARE
Immigrants from Iraq
Iroquois
Family Poverty
Family Poverty Comparison
Immigrants from Iraq
Iroquois
9.1%
FAMILY POVERTY
44.4/ 100
METRIC RATING
179th/ 347
METRIC RANK
10.7%
FAMILY POVERTY
0.3/ 100
METRIC RATING
251st/ 347
METRIC RANK
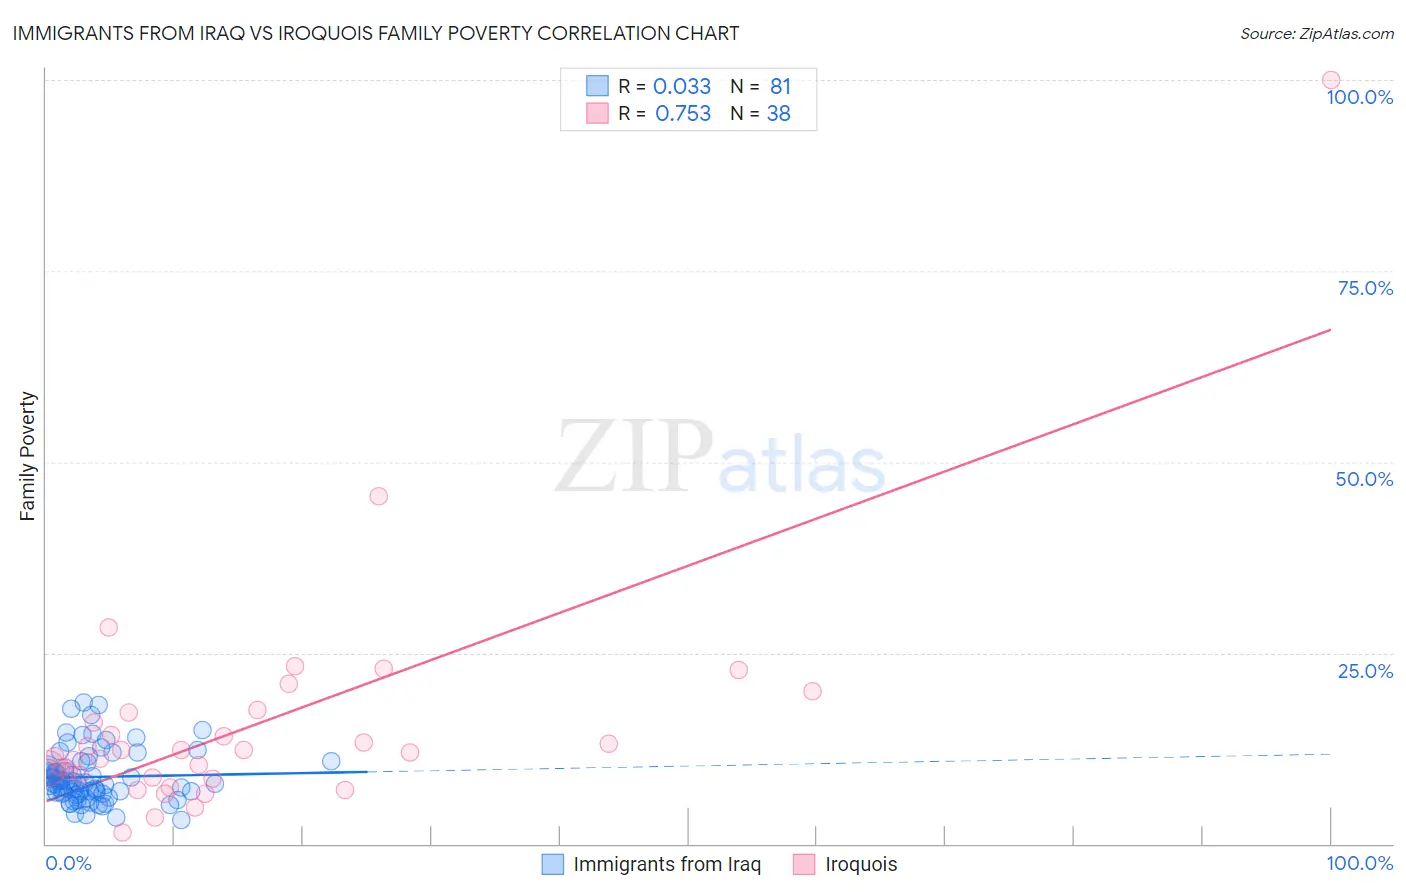
Immigrants from Iraq vs Iroquois Family Poverty Correlation Chart
The statistical analysis conducted on geographies consisting of 194,634,857 people shows no correlation between the proportion of Immigrants from Iraq and poverty level among families in the United States with a correlation coefficient (R) of 0.033 and weighted average of 9.1%. Similarly, the statistical analysis conducted on geographies consisting of 207,014,123 people shows a strong positive correlation between the proportion of Iroquois and poverty level among families in the United States with a correlation coefficient (R) of 0.753 and weighted average of 10.7%, a difference of 18.1%.
Family Poverty Correlation Summary
| Measurement | Immigrants from Iraq | Iroquois |
| Minimum | 3.1% | 1.5% |
| Maximum | 18.5% | 100.0% |
| Range | 15.4% | 98.5% |
| Mean | 8.7% | 15.6% |
| Median | 7.9% | 12.1% |
| Interquartile 25% (IQ1) | 6.6% | 8.6% |
| Interquartile 75% (IQ3) | 10.3% | 17.2% |
| Interquartile Range (IQR) | 3.7% | 8.6% |
| Standard Deviation (Sample) | 3.4% | 16.1% |
| Standard Deviation (Population) | 3.4% | 15.9% |
Similar Demographics by Family Poverty
Demographics Similar to Immigrants from Iraq by Family Poverty
In terms of family poverty, the demographic groups most similar to Immigrants from Iraq are Immigrants from Uganda (9.1%, a difference of 0.13%), Immigrants from Cameroon (9.0%, a difference of 0.36%), Hawaiian (9.0%, a difference of 0.38%), Immigrants from Syria (9.0%, a difference of 0.41%), and Hmong (9.1%, a difference of 0.56%).
| Demographics | Rating | Rank | Family Poverty |
| Immigrants | Peru | 57.5 /100 | #172 | Average 8.9% |
| Immigrants | Fiji | 56.4 /100 | #173 | Average 8.9% |
| Immigrants | Albania | 50.0 /100 | #174 | Average 9.0% |
| Costa Ricans | 49.3 /100 | #175 | Average 9.0% |
| Immigrants | Syria | 47.5 /100 | #176 | Average 9.0% |
| Hawaiians | 47.2 /100 | #177 | Average 9.0% |
| Immigrants | Cameroon | 47.1 /100 | #178 | Average 9.0% |
| Immigrants | Iraq | 44.4 /100 | #179 | Average 9.1% |
| Immigrants | Uganda | 43.4 /100 | #180 | Average 9.1% |
| Hmong | 40.2 /100 | #181 | Average 9.1% |
| Immigrants | Morocco | 40.2 /100 | #182 | Average 9.1% |
| Uruguayans | 39.2 /100 | #183 | Fair 9.1% |
| South American Indians | 38.7 /100 | #184 | Fair 9.1% |
| Immigrants | Saudi Arabia | 38.6 /100 | #185 | Fair 9.1% |
| Colombians | 36.1 /100 | #186 | Fair 9.2% |
Demographics Similar to Iroquois by Family Poverty
In terms of family poverty, the demographic groups most similar to Iroquois are Immigrants from Zaire (10.7%, a difference of 0.12%), Immigrants from Western Africa (10.7%, a difference of 0.23%), Salvadoran (10.7%, a difference of 0.28%), Ecuadorian (10.8%, a difference of 0.53%), and Cuban (10.6%, a difference of 0.81%).
| Demographics | Rating | Rank | Family Poverty |
| Cree | 0.7 /100 | #244 | Tragic 10.5% |
| Immigrants | Burma/Myanmar | 0.6 /100 | #245 | Tragic 10.5% |
| Cherokee | 0.5 /100 | #246 | Tragic 10.6% |
| Liberians | 0.4 /100 | #247 | Tragic 10.6% |
| Nicaraguans | 0.4 /100 | #248 | Tragic 10.6% |
| Cubans | 0.4 /100 | #249 | Tragic 10.6% |
| Salvadorans | 0.3 /100 | #250 | Tragic 10.7% |
| Iroquois | 0.3 /100 | #251 | Tragic 10.7% |
| Immigrants | Zaire | 0.3 /100 | #252 | Tragic 10.7% |
| Immigrants | Western Africa | 0.3 /100 | #253 | Tragic 10.7% |
| Ecuadorians | 0.2 /100 | #254 | Tragic 10.8% |
| Immigrants | Liberia | 0.2 /100 | #255 | Tragic 10.8% |
| Chickasaw | 0.2 /100 | #256 | Tragic 10.8% |
| Immigrants | Ghana | 0.2 /100 | #257 | Tragic 10.8% |
| Sub-Saharan Africans | 0.2 /100 | #258 | Tragic 10.9% |