Immigrants from Iraq vs Iroquois Seniors Poverty Over the Age of 75
COMPARE
Immigrants from Iraq
Iroquois
Seniors Poverty Over the Age of 75
Seniors Poverty Over the Age of 75 Comparison
Immigrants from Iraq
Iroquois
11.5%
SENIORS POVERTY OVER THE AGE OF 75
94.9/ 100
METRIC RATING
84th/ 347
METRIC RANK
14.0%
SENIORS POVERTY OVER THE AGE OF 75
0.1/ 100
METRIC RATING
263rd/ 347
METRIC RANK
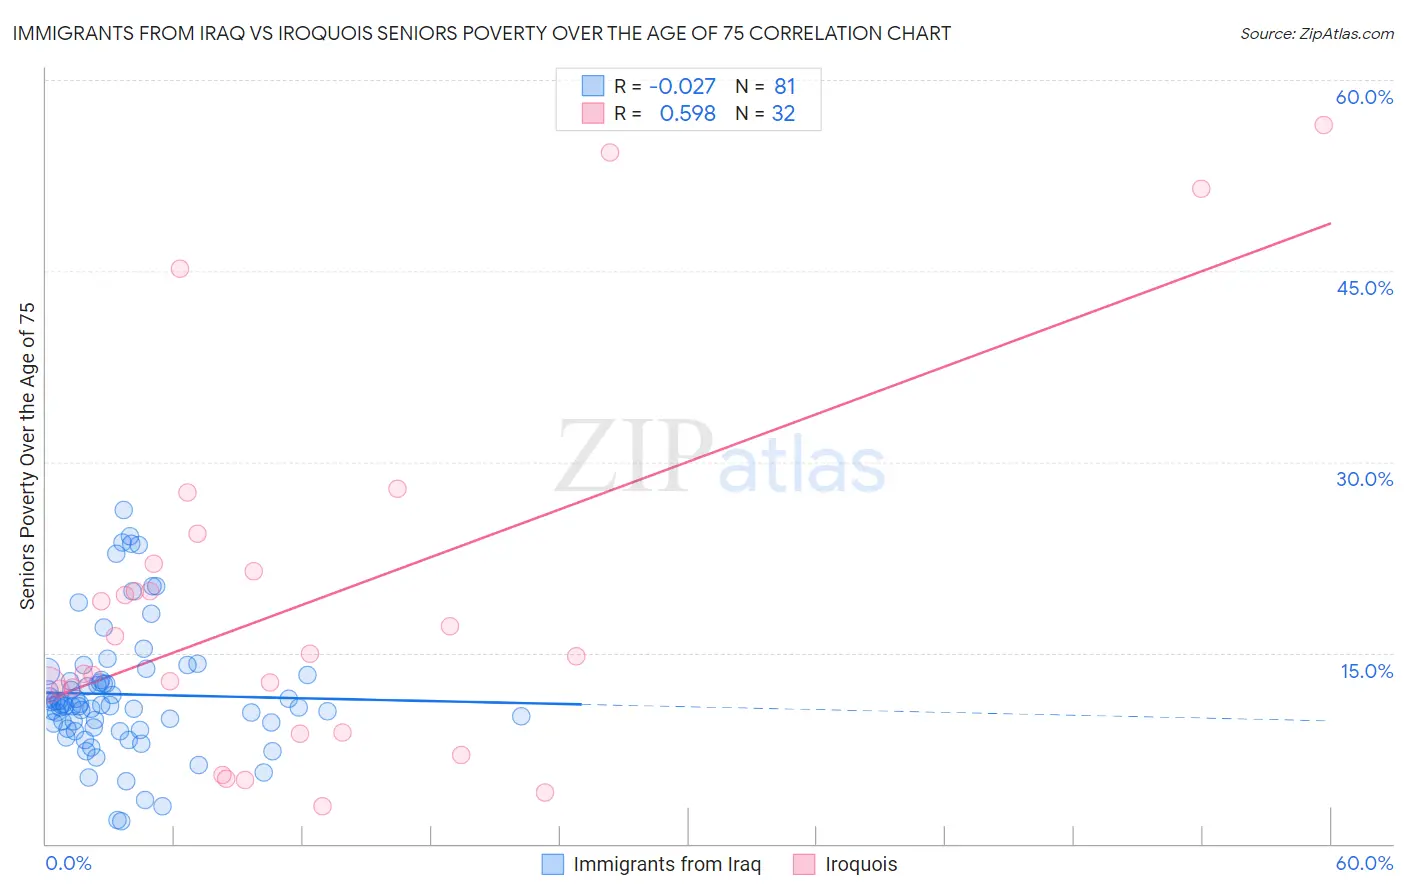
Immigrants from Iraq vs Iroquois Seniors Poverty Over the Age of 75 Correlation Chart
The statistical analysis conducted on geographies consisting of 194,011,425 people shows no correlation between the proportion of Immigrants from Iraq and poverty level among seniors over the age of 75 in the United States with a correlation coefficient (R) of -0.027 and weighted average of 11.5%. Similarly, the statistical analysis conducted on geographies consisting of 205,964,404 people shows a substantial positive correlation between the proportion of Iroquois and poverty level among seniors over the age of 75 in the United States with a correlation coefficient (R) of 0.598 and weighted average of 14.0%, a difference of 22.2%.
Seniors Poverty Over the Age of 75 Correlation Summary
| Measurement | Immigrants from Iraq | Iroquois |
| Minimum | 1.8% | 2.9% |
| Maximum | 26.2% | 56.5% |
| Range | 24.4% | 53.5% |
| Mean | 11.7% | 19.0% |
| Median | 10.9% | 14.9% |
| Interquartile 25% (IQ1) | 9.1% | 10.4% |
| Interquartile 75% (IQ3) | 13.0% | 21.7% |
| Interquartile Range (IQR) | 4.0% | 11.3% |
| Standard Deviation (Sample) | 5.0% | 14.3% |
| Standard Deviation (Population) | 5.0% | 14.1% |
Similar Demographics by Seniors Poverty Over the Age of 75
Demographics Similar to Immigrants from Iraq by Seniors Poverty Over the Age of 75
In terms of seniors poverty over the age of 75, the demographic groups most similar to Immigrants from Iraq are Immigrants from South Africa (11.5%, a difference of 0.0%), Iranian (11.5%, a difference of 0.090%), Basque (11.5%, a difference of 0.10%), Immigrants from Bulgaria (11.5%, a difference of 0.10%), and Australian (11.5%, a difference of 0.12%).
| Demographics | Rating | Rank | Seniors Poverty Over the Age of 75 |
| Whites/Caucasians | 95.5 /100 | #77 | Exceptional 11.4% |
| Macedonians | 95.5 /100 | #78 | Exceptional 11.4% |
| Filipinos | 95.5 /100 | #79 | Exceptional 11.4% |
| Alaska Natives | 95.4 /100 | #80 | Exceptional 11.4% |
| Basques | 95.1 /100 | #81 | Exceptional 11.5% |
| Iranians | 95.1 /100 | #82 | Exceptional 11.5% |
| Immigrants | South Africa | 94.9 /100 | #83 | Exceptional 11.5% |
| Immigrants | Iraq | 94.9 /100 | #84 | Exceptional 11.5% |
| Immigrants | Bulgaria | 94.7 /100 | #85 | Exceptional 11.5% |
| Australians | 94.6 /100 | #86 | Exceptional 11.5% |
| Koreans | 94.5 /100 | #87 | Exceptional 11.5% |
| Immigrants | Croatia | 94.5 /100 | #88 | Exceptional 11.5% |
| Immigrants | Sri Lanka | 94.4 /100 | #89 | Exceptional 11.5% |
| Aleuts | 94.1 /100 | #90 | Exceptional 11.5% |
| Immigrants | Germany | 94.1 /100 | #91 | Exceptional 11.5% |
Demographics Similar to Iroquois by Seniors Poverty Over the Age of 75
In terms of seniors poverty over the age of 75, the demographic groups most similar to Iroquois are Cajun (14.0%, a difference of 0.13%), Ghanaian (14.0%, a difference of 0.36%), Immigrants (13.9%, a difference of 0.46%), Immigrants from Portugal (13.9%, a difference of 0.53%), and Immigrants from Panama (13.9%, a difference of 0.57%).
| Demographics | Rating | Rank | Seniors Poverty Over the Age of 75 |
| Inupiat | 0.1 /100 | #256 | Tragic 13.8% |
| Immigrants | Western Africa | 0.1 /100 | #257 | Tragic 13.9% |
| Immigrants | Panama | 0.1 /100 | #258 | Tragic 13.9% |
| Immigrants | Portugal | 0.1 /100 | #259 | Tragic 13.9% |
| Immigrants | Immigrants | 0.1 /100 | #260 | Tragic 13.9% |
| Ghanaians | 0.1 /100 | #261 | Tragic 14.0% |
| Cajuns | 0.1 /100 | #262 | Tragic 14.0% |
| Iroquois | 0.1 /100 | #263 | Tragic 14.0% |
| South Americans | 0.0 /100 | #264 | Tragic 14.1% |
| Salvadorans | 0.0 /100 | #265 | Tragic 14.2% |
| Armenians | 0.0 /100 | #266 | Tragic 14.2% |
| Venezuelans | 0.0 /100 | #267 | Tragic 14.2% |
| Colombians | 0.0 /100 | #268 | Tragic 14.3% |
| Immigrants | Venezuela | 0.0 /100 | #269 | Tragic 14.3% |
| Immigrants | Uruguay | 0.0 /100 | #270 | Tragic 14.3% |