Immigrants from Iraq vs Tongan Family Poverty
COMPARE
Immigrants from Iraq
Tongan
Family Poverty
Family Poverty Comparison
Immigrants from Iraq
Tongans
9.1%
FAMILY POVERTY
44.4/ 100
METRIC RATING
179th/ 347
METRIC RANK
7.7%
FAMILY POVERTY
98.9/ 100
METRIC RATING
46th/ 347
METRIC RANK
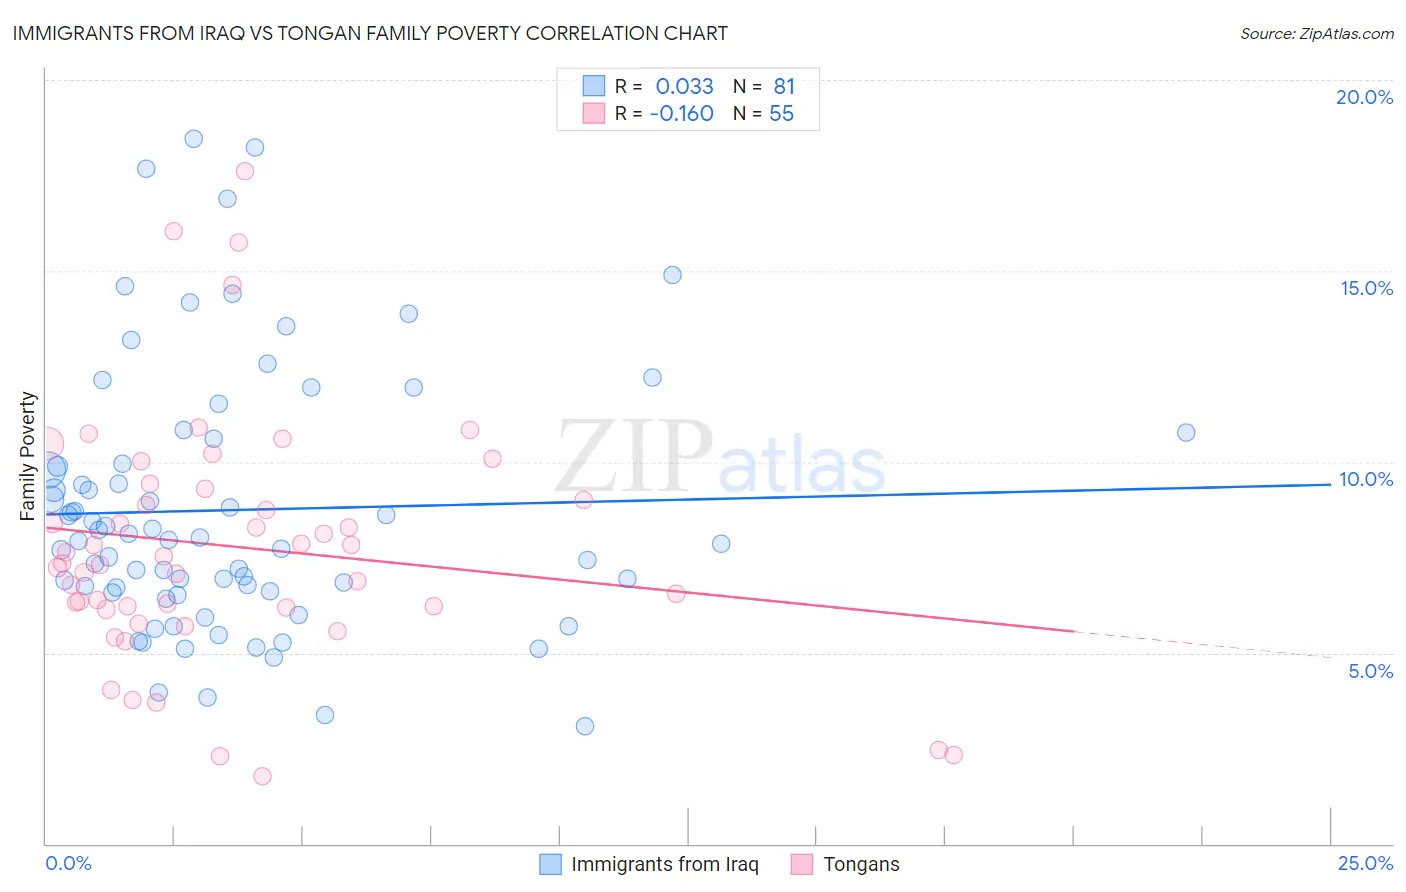
Immigrants from Iraq vs Tongan Family Poverty Correlation Chart
The statistical analysis conducted on geographies consisting of 194,634,857 people shows no correlation between the proportion of Immigrants from Iraq and poverty level among families in the United States with a correlation coefficient (R) of 0.033 and weighted average of 9.1%. Similarly, the statistical analysis conducted on geographies consisting of 102,821,565 people shows a poor negative correlation between the proportion of Tongans and poverty level among families in the United States with a correlation coefficient (R) of -0.160 and weighted average of 7.7%, a difference of 18.3%.
Family Poverty Correlation Summary
| Measurement | Immigrants from Iraq | Tongan |
| Minimum | 3.1% | 1.8% |
| Maximum | 18.5% | 17.6% |
| Range | 15.4% | 15.9% |
| Mean | 8.7% | 7.8% |
| Median | 7.9% | 7.3% |
| Interquartile 25% (IQ1) | 6.6% | 6.2% |
| Interquartile 75% (IQ3) | 10.3% | 9.3% |
| Interquartile Range (IQR) | 3.7% | 3.1% |
| Standard Deviation (Sample) | 3.4% | 3.2% |
| Standard Deviation (Population) | 3.4% | 3.2% |
Similar Demographics by Family Poverty
Demographics Similar to Immigrants from Iraq by Family Poverty
In terms of family poverty, the demographic groups most similar to Immigrants from Iraq are Immigrants from Uganda (9.1%, a difference of 0.13%), Immigrants from Cameroon (9.0%, a difference of 0.36%), Hawaiian (9.0%, a difference of 0.38%), Immigrants from Syria (9.0%, a difference of 0.41%), and Hmong (9.1%, a difference of 0.56%).
| Demographics | Rating | Rank | Family Poverty |
| Immigrants | Peru | 57.5 /100 | #172 | Average 8.9% |
| Immigrants | Fiji | 56.4 /100 | #173 | Average 8.9% |
| Immigrants | Albania | 50.0 /100 | #174 | Average 9.0% |
| Costa Ricans | 49.3 /100 | #175 | Average 9.0% |
| Immigrants | Syria | 47.5 /100 | #176 | Average 9.0% |
| Hawaiians | 47.2 /100 | #177 | Average 9.0% |
| Immigrants | Cameroon | 47.1 /100 | #178 | Average 9.0% |
| Immigrants | Iraq | 44.4 /100 | #179 | Average 9.1% |
| Immigrants | Uganda | 43.4 /100 | #180 | Average 9.1% |
| Hmong | 40.2 /100 | #181 | Average 9.1% |
| Immigrants | Morocco | 40.2 /100 | #182 | Average 9.1% |
| Uruguayans | 39.2 /100 | #183 | Fair 9.1% |
| South American Indians | 38.7 /100 | #184 | Fair 9.1% |
| Immigrants | Saudi Arabia | 38.6 /100 | #185 | Fair 9.1% |
| Colombians | 36.1 /100 | #186 | Fair 9.2% |
Demographics Similar to Tongans by Family Poverty
In terms of family poverty, the demographic groups most similar to Tongans are Okinawan (7.7%, a difference of 0.010%), Immigrants from Czechoslovakia (7.7%, a difference of 0.010%), Immigrants from Sri Lanka (7.7%, a difference of 0.030%), German (7.7%, a difference of 0.14%), and Immigrants from Bolivia (7.7%, a difference of 0.22%).
| Demographics | Rating | Rank | Family Poverty |
| Carpatho Rusyns | 99.3 /100 | #39 | Exceptional 7.5% |
| Slovenes | 99.3 /100 | #40 | Exceptional 7.5% |
| Immigrants | Australia | 99.2 /100 | #41 | Exceptional 7.6% |
| Scandinavians | 99.1 /100 | #42 | Exceptional 7.6% |
| Immigrants | Austria | 99.1 /100 | #43 | Exceptional 7.6% |
| Germans | 99.0 /100 | #44 | Exceptional 7.7% |
| Okinawans | 98.9 /100 | #45 | Exceptional 7.7% |
| Tongans | 98.9 /100 | #46 | Exceptional 7.7% |
| Immigrants | Czechoslovakia | 98.9 /100 | #47 | Exceptional 7.7% |
| Immigrants | Sri Lanka | 98.9 /100 | #48 | Exceptional 7.7% |
| Immigrants | Bolivia | 98.9 /100 | #49 | Exceptional 7.7% |
| Immigrants | North Macedonia | 98.9 /100 | #50 | Exceptional 7.7% |
| Immigrants | Moldova | 98.8 /100 | #51 | Exceptional 7.7% |
| Indians (Asian) | 98.8 /100 | #52 | Exceptional 7.7% |
| Swiss | 98.8 /100 | #53 | Exceptional 7.7% |