Immigrants from Ghana vs Mexican Poverty
COMPARE
Immigrants from Ghana
Mexican
Poverty
Poverty Comparison
Immigrants from Ghana
Mexicans
14.2%
POVERTY
0.2/ 100
METRIC RATING
249th/ 347
METRIC RANK
15.1%
POVERTY
0.0/ 100
METRIC RATING
290th/ 347
METRIC RANK
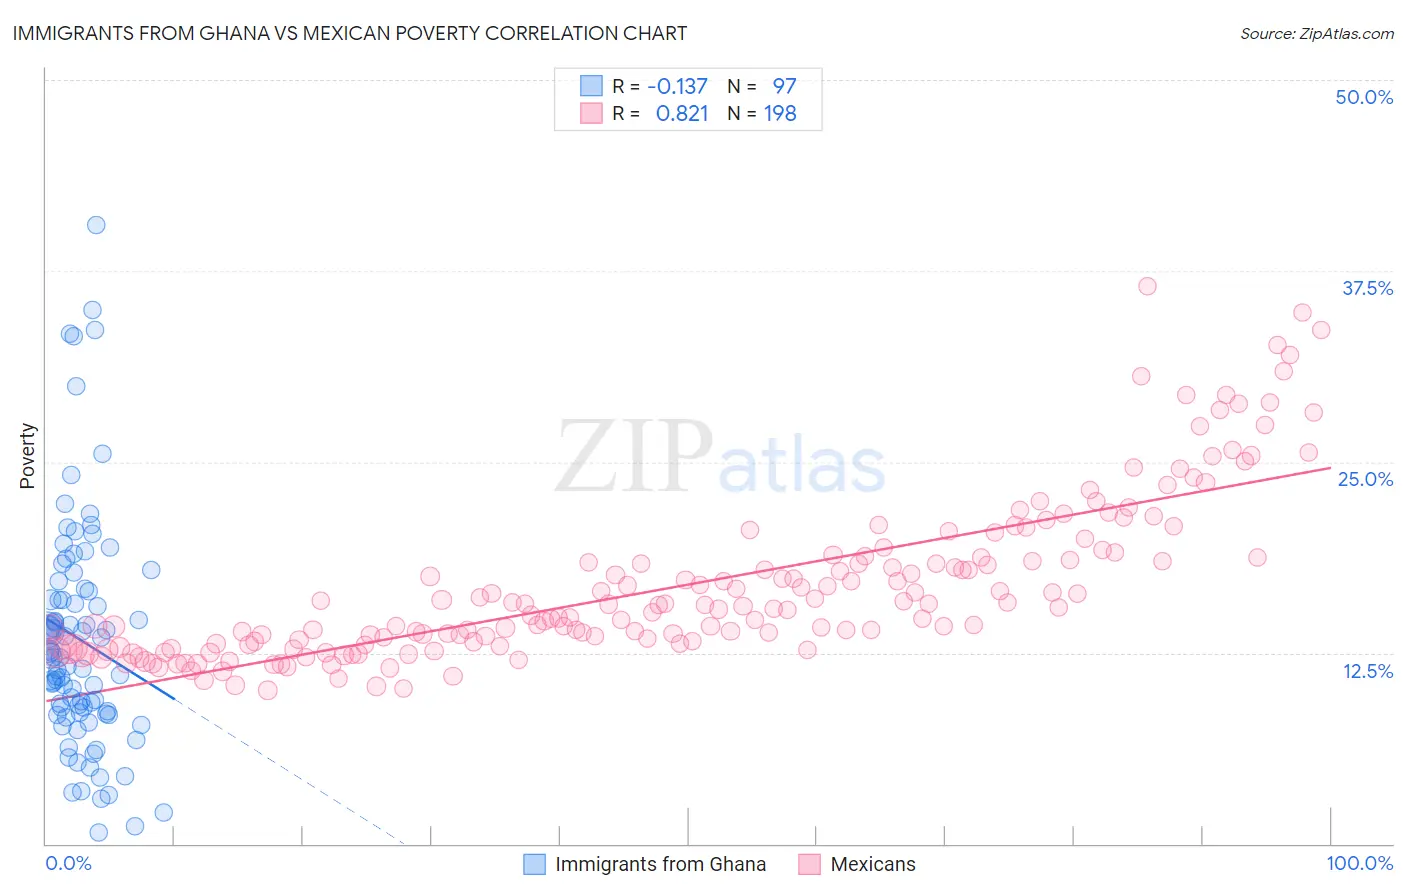
Immigrants from Ghana vs Mexican Poverty Correlation Chart
The statistical analysis conducted on geographies consisting of 199,808,032 people shows a poor negative correlation between the proportion of Immigrants from Ghana and poverty level in the United States with a correlation coefficient (R) of -0.137 and weighted average of 14.2%. Similarly, the statistical analysis conducted on geographies consisting of 564,427,713 people shows a very strong positive correlation between the proportion of Mexicans and poverty level in the United States with a correlation coefficient (R) of 0.821 and weighted average of 15.1%, a difference of 6.7%.
Poverty Correlation Summary
| Measurement | Immigrants from Ghana | Mexican |
| Minimum | 0.71% | 10.1% |
| Maximum | 40.5% | 36.5% |
| Range | 39.8% | 26.4% |
| Mean | 13.4% | 16.9% |
| Median | 12.2% | 15.4% |
| Interquartile 25% (IQ1) | 8.5% | 13.1% |
| Interquartile 75% (IQ3) | 16.6% | 18.7% |
| Interquartile Range (IQR) | 8.1% | 5.6% |
| Standard Deviation (Sample) | 7.6% | 5.3% |
| Standard Deviation (Population) | 7.5% | 5.3% |
Similar Demographics by Poverty
Demographics Similar to Immigrants from Ghana by Poverty
In terms of poverty, the demographic groups most similar to Immigrants from Ghana are Immigrants from Western Africa (14.1%, a difference of 0.090%), Liberian (14.1%, a difference of 0.11%), Cree (14.2%, a difference of 0.30%), Immigrants from Burma/Myanmar (14.2%, a difference of 0.39%), and Potawatomi (14.1%, a difference of 0.40%).
| Demographics | Rating | Rank | Poverty |
| Ecuadorians | 0.4 /100 | #242 | Tragic 14.0% |
| Sudanese | 0.3 /100 | #243 | Tragic 14.0% |
| Nepalese | 0.3 /100 | #244 | Tragic 14.0% |
| Immigrants | Sudan | 0.3 /100 | #245 | Tragic 14.1% |
| Potawatomi | 0.3 /100 | #246 | Tragic 14.1% |
| Liberians | 0.2 /100 | #247 | Tragic 14.1% |
| Immigrants | Western Africa | 0.2 /100 | #248 | Tragic 14.1% |
| Immigrants | Ghana | 0.2 /100 | #249 | Tragic 14.2% |
| Cree | 0.2 /100 | #250 | Tragic 14.2% |
| Immigrants | Burma/Myanmar | 0.2 /100 | #251 | Tragic 14.2% |
| Spanish American Indians | 0.2 /100 | #252 | Tragic 14.2% |
| Immigrants | Trinidad and Tobago | 0.2 /100 | #253 | Tragic 14.2% |
| Immigrants | El Salvador | 0.1 /100 | #254 | Tragic 14.3% |
| Immigrants | Ecuador | 0.1 /100 | #255 | Tragic 14.3% |
| Mexican American Indians | 0.1 /100 | #256 | Tragic 14.3% |
Demographics Similar to Mexicans by Poverty
In terms of poverty, the demographic groups most similar to Mexicans are Immigrants from Belize (15.1%, a difference of 0.10%), Immigrants from Cabo Verde (15.1%, a difference of 0.13%), Indonesian (15.1%, a difference of 0.18%), Immigrants from Zaire (15.1%, a difference of 0.18%), and Yaqui (15.1%, a difference of 0.22%).
| Demographics | Rating | Rank | Poverty |
| Immigrants | Haiti | 0.0 /100 | #283 | Tragic 15.0% |
| West Indians | 0.0 /100 | #284 | Tragic 15.0% |
| Vietnamese | 0.0 /100 | #285 | Tragic 15.0% |
| Immigrants | Latin America | 0.0 /100 | #286 | Tragic 15.0% |
| Inupiat | 0.0 /100 | #287 | Tragic 15.1% |
| Yaqui | 0.0 /100 | #288 | Tragic 15.1% |
| Immigrants | Belize | 0.0 /100 | #289 | Tragic 15.1% |
| Mexicans | 0.0 /100 | #290 | Tragic 15.1% |
| Immigrants | Cabo Verde | 0.0 /100 | #291 | Tragic 15.1% |
| Indonesians | 0.0 /100 | #292 | Tragic 15.1% |
| Immigrants | Zaire | 0.0 /100 | #293 | Tragic 15.1% |
| Blackfeet | 0.0 /100 | #294 | Tragic 15.2% |
| Guatemalans | 0.0 /100 | #295 | Tragic 15.3% |
| Hispanics or Latinos | 0.0 /100 | #296 | Tragic 15.3% |
| Immigrants | Bangladesh | 0.0 /100 | #297 | Tragic 15.3% |