Immigrants from Ghana vs Asian Poverty
COMPARE
Immigrants from Ghana
Asian
Poverty
Poverty Comparison
Immigrants from Ghana
Asians
14.2%
POVERTY
0.2/ 100
METRIC RATING
249th/ 347
METRIC RANK
11.0%
POVERTY
98.9/ 100
METRIC RATING
50th/ 347
METRIC RANK
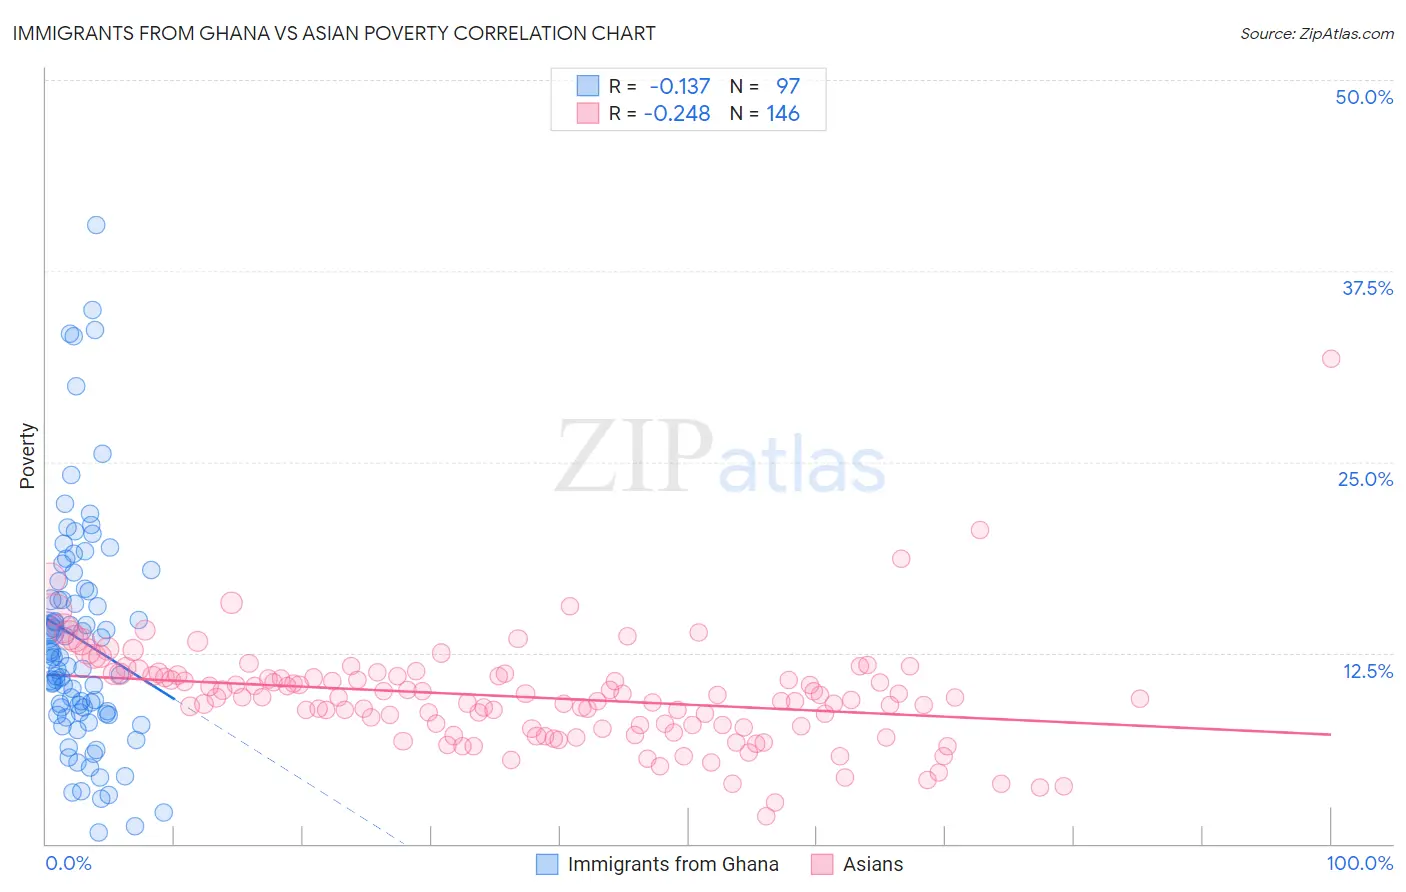
Immigrants from Ghana vs Asian Poverty Correlation Chart
The statistical analysis conducted on geographies consisting of 199,808,032 people shows a poor negative correlation between the proportion of Immigrants from Ghana and poverty level in the United States with a correlation coefficient (R) of -0.137 and weighted average of 14.2%. Similarly, the statistical analysis conducted on geographies consisting of 550,188,892 people shows a weak negative correlation between the proportion of Asians and poverty level in the United States with a correlation coefficient (R) of -0.248 and weighted average of 11.0%, a difference of 28.9%.
Poverty Correlation Summary
| Measurement | Immigrants from Ghana | Asian |
| Minimum | 0.71% | 1.8% |
| Maximum | 40.5% | 31.8% |
| Range | 39.8% | 29.9% |
| Mean | 13.4% | 9.6% |
| Median | 12.2% | 9.6% |
| Interquartile 25% (IQ1) | 8.5% | 7.6% |
| Interquartile 75% (IQ3) | 16.6% | 11.0% |
| Interquartile Range (IQR) | 8.1% | 3.4% |
| Standard Deviation (Sample) | 7.6% | 3.5% |
| Standard Deviation (Population) | 7.5% | 3.5% |
Similar Demographics by Poverty
Demographics Similar to Immigrants from Ghana by Poverty
In terms of poverty, the demographic groups most similar to Immigrants from Ghana are Immigrants from Western Africa (14.1%, a difference of 0.090%), Liberian (14.1%, a difference of 0.11%), Cree (14.2%, a difference of 0.30%), Immigrants from Burma/Myanmar (14.2%, a difference of 0.39%), and Potawatomi (14.1%, a difference of 0.40%).
| Demographics | Rating | Rank | Poverty |
| Ecuadorians | 0.4 /100 | #242 | Tragic 14.0% |
| Sudanese | 0.3 /100 | #243 | Tragic 14.0% |
| Nepalese | 0.3 /100 | #244 | Tragic 14.0% |
| Immigrants | Sudan | 0.3 /100 | #245 | Tragic 14.1% |
| Potawatomi | 0.3 /100 | #246 | Tragic 14.1% |
| Liberians | 0.2 /100 | #247 | Tragic 14.1% |
| Immigrants | Western Africa | 0.2 /100 | #248 | Tragic 14.1% |
| Immigrants | Ghana | 0.2 /100 | #249 | Tragic 14.2% |
| Cree | 0.2 /100 | #250 | Tragic 14.2% |
| Immigrants | Burma/Myanmar | 0.2 /100 | #251 | Tragic 14.2% |
| Spanish American Indians | 0.2 /100 | #252 | Tragic 14.2% |
| Immigrants | Trinidad and Tobago | 0.2 /100 | #253 | Tragic 14.2% |
| Immigrants | El Salvador | 0.1 /100 | #254 | Tragic 14.3% |
| Immigrants | Ecuador | 0.1 /100 | #255 | Tragic 14.3% |
| Mexican American Indians | 0.1 /100 | #256 | Tragic 14.3% |
Demographics Similar to Asians by Poverty
In terms of poverty, the demographic groups most similar to Asians are Immigrants from Japan (11.0%, a difference of 0.030%), Slovene (11.0%, a difference of 0.040%), Immigrants from Romania (11.0%, a difference of 0.080%), Immigrants from Czechoslovakia (11.0%, a difference of 0.10%), and Turkish (11.0%, a difference of 0.18%).
| Demographics | Rating | Rank | Poverty |
| Immigrants | Singapore | 99.2 /100 | #43 | Exceptional 10.9% |
| Immigrants | Moldova | 99.1 /100 | #44 | Exceptional 10.9% |
| Turks | 98.9 /100 | #45 | Exceptional 11.0% |
| Immigrants | Czechoslovakia | 98.9 /100 | #46 | Exceptional 11.0% |
| Immigrants | Romania | 98.9 /100 | #47 | Exceptional 11.0% |
| Slovenes | 98.9 /100 | #48 | Exceptional 11.0% |
| Immigrants | Japan | 98.9 /100 | #49 | Exceptional 11.0% |
| Asians | 98.9 /100 | #50 | Exceptional 11.0% |
| Immigrants | Croatia | 98.7 /100 | #51 | Exceptional 11.0% |
| Immigrants | Philippines | 98.7 /100 | #52 | Exceptional 11.0% |
| Immigrants | Austria | 98.6 /100 | #53 | Exceptional 11.1% |
| Immigrants | Bulgaria | 98.5 /100 | #54 | Exceptional 11.1% |
| Immigrants | Serbia | 98.5 /100 | #55 | Exceptional 11.1% |
| Estonians | 98.2 /100 | #56 | Exceptional 11.1% |
| Scandinavians | 98.2 /100 | #57 | Exceptional 11.1% |