Immigrants from Colombia vs Belgian Receiving Food Stamps
COMPARE
Immigrants from Colombia
Belgian
Receiving Food Stamps
Receiving Food Stamps Comparison
Immigrants from Colombia
Belgians
12.9%
RECEIVING FOOD STAMPS
5.3/ 100
METRIC RATING
220th/ 347
METRIC RANK
10.2%
RECEIVING FOOD STAMPS
97.7/ 100
METRIC RATING
93rd/ 347
METRIC RANK
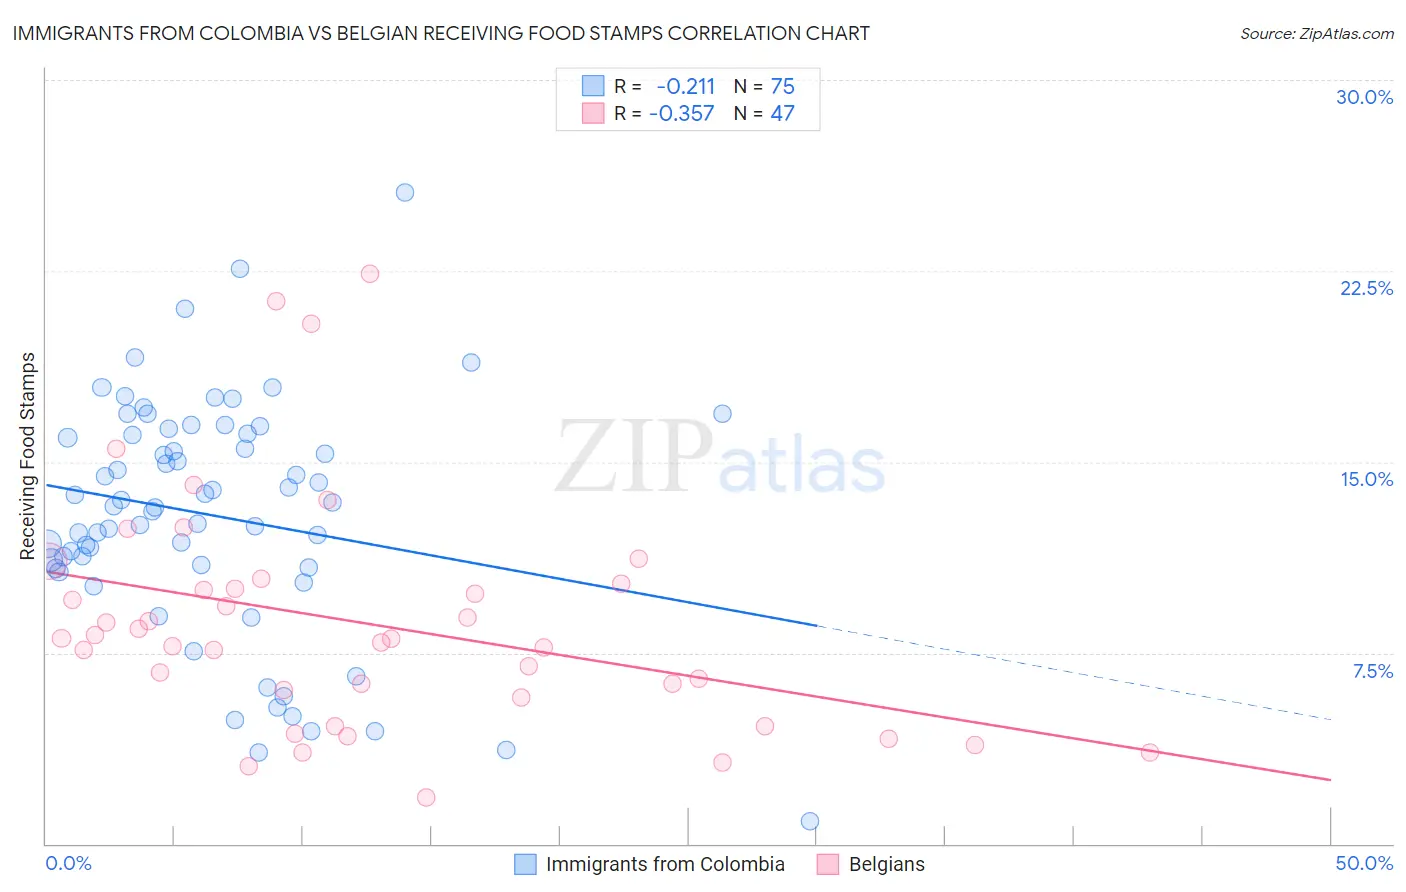
Immigrants from Colombia vs Belgian Receiving Food Stamps Correlation Chart
The statistical analysis conducted on geographies consisting of 377,668,095 people shows a weak negative correlation between the proportion of Immigrants from Colombia and percentage of population receiving government assistance and/or food stamps in the United States with a correlation coefficient (R) of -0.211 and weighted average of 12.9%. Similarly, the statistical analysis conducted on geographies consisting of 355,046,721 people shows a mild negative correlation between the proportion of Belgians and percentage of population receiving government assistance and/or food stamps in the United States with a correlation coefficient (R) of -0.357 and weighted average of 10.2%, a difference of 26.7%.
Receiving Food Stamps Correlation Summary
| Measurement | Immigrants from Colombia | Belgian |
| Minimum | 0.90% | 1.8% |
| Maximum | 25.6% | 22.4% |
| Range | 24.7% | 20.6% |
| Mean | 12.9% | 8.7% |
| Median | 13.3% | 8.1% |
| Interquartile 25% (IQ1) | 10.8% | 5.8% |
| Interquartile 75% (IQ3) | 16.1% | 10.2% |
| Interquartile Range (IQR) | 5.3% | 4.4% |
| Standard Deviation (Sample) | 4.6% | 4.6% |
| Standard Deviation (Population) | 4.6% | 4.5% |
Similar Demographics by Receiving Food Stamps
Demographics Similar to Immigrants from Colombia by Receiving Food Stamps
In terms of receiving food stamps, the demographic groups most similar to Immigrants from Colombia are Immigrants from Middle Africa (12.9%, a difference of 0.040%), Hawaiian (12.9%, a difference of 0.050%), Bermudan (13.0%, a difference of 0.32%), Immigrants from Burma/Myanmar (12.9%, a difference of 0.41%), and Immigrants (13.0%, a difference of 0.58%).
| Demographics | Rating | Rank | Receiving Food Stamps |
| Moroccans | 7.6 /100 | #213 | Tragic 12.8% |
| Immigrants | Africa | 7.6 /100 | #214 | Tragic 12.8% |
| Native Hawaiians | 6.7 /100 | #215 | Tragic 12.8% |
| Immigrants | South America | 6.5 /100 | #216 | Tragic 12.8% |
| Immigrants | Burma/Myanmar | 6.0 /100 | #217 | Tragic 12.9% |
| Hawaiians | 5.4 /100 | #218 | Tragic 12.9% |
| Immigrants | Middle Africa | 5.4 /100 | #219 | Tragic 12.9% |
| Immigrants | Colombia | 5.3 /100 | #220 | Tragic 12.9% |
| Bermudans | 4.8 /100 | #221 | Tragic 13.0% |
| Immigrants | Immigrants | 4.4 /100 | #222 | Tragic 13.0% |
| Immigrants | Albania | 4.4 /100 | #223 | Tragic 13.0% |
| Immigrants | Armenia | 4.3 /100 | #224 | Tragic 13.0% |
| Fijians | 4.3 /100 | #225 | Tragic 13.0% |
| Chickasaw | 3.6 /100 | #226 | Tragic 13.1% |
| Nigerians | 3.5 /100 | #227 | Tragic 13.1% |
Demographics Similar to Belgians by Receiving Food Stamps
In terms of receiving food stamps, the demographic groups most similar to Belgians are Irish (10.2%, a difference of 0.38%), Jordanian (10.2%, a difference of 0.39%), Finnish (10.2%, a difference of 0.42%), Immigrants from Greece (10.3%, a difference of 0.53%), and Basque (10.3%, a difference of 0.55%).
| Demographics | Rating | Rank | Receiving Food Stamps |
| Immigrants | Norway | 98.4 /100 | #86 | Exceptional 10.0% |
| Egyptians | 98.4 /100 | #87 | Exceptional 10.0% |
| Immigrants | Kuwait | 98.4 /100 | #88 | Exceptional 10.0% |
| Immigrants | France | 98.3 /100 | #89 | Exceptional 10.1% |
| Finns | 97.9 /100 | #90 | Exceptional 10.2% |
| Jordanians | 97.9 /100 | #91 | Exceptional 10.2% |
| Irish | 97.9 /100 | #92 | Exceptional 10.2% |
| Belgians | 97.7 /100 | #93 | Exceptional 10.2% |
| Immigrants | Greece | 97.4 /100 | #94 | Exceptional 10.3% |
| Basques | 97.4 /100 | #95 | Exceptional 10.3% |
| Welsh | 97.3 /100 | #96 | Exceptional 10.3% |
| Czechoslovakians | 97.2 /100 | #97 | Exceptional 10.3% |
| Immigrants | Egypt | 97.1 /100 | #98 | Exceptional 10.3% |
| Serbians | 97.0 /100 | #99 | Exceptional 10.3% |
| Immigrants | Western Europe | 96.9 /100 | #100 | Exceptional 10.3% |