Ecuadorian vs Immigrants from Bulgaria Receiving Food Stamps
COMPARE
Ecuadorian
Immigrants from Bulgaria
Receiving Food Stamps
Receiving Food Stamps Comparison
Ecuadorians
Immigrants from Bulgaria
14.9%
RECEIVING FOOD STAMPS
0.0/ 100
METRIC RATING
280th/ 347
METRIC RANK
9.8%
RECEIVING FOOD STAMPS
99.2/ 100
METRIC RATING
62nd/ 347
METRIC RANK
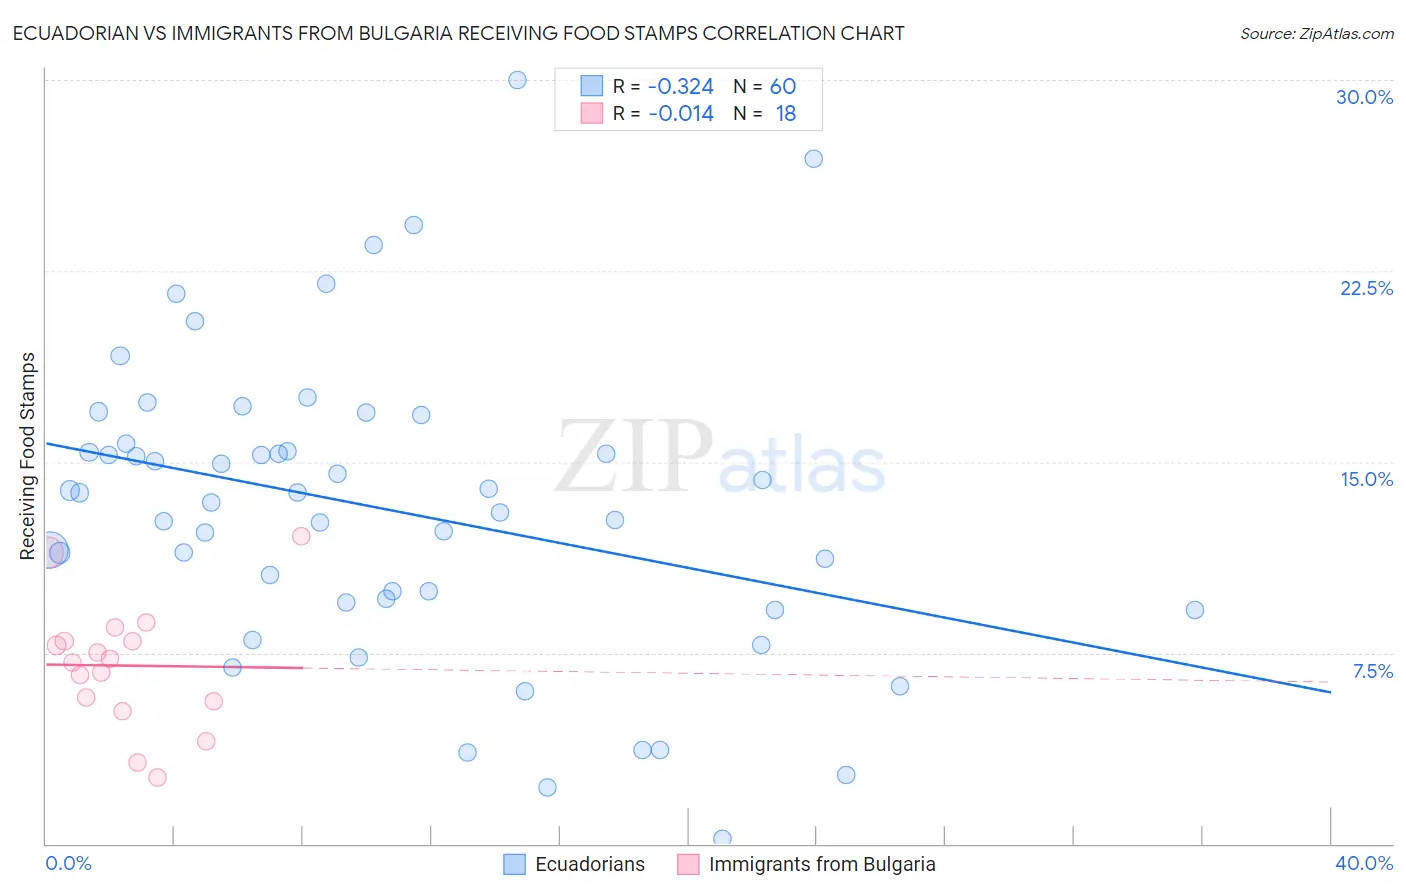
Ecuadorian vs Immigrants from Bulgaria Receiving Food Stamps Correlation Chart
The statistical analysis conducted on geographies consisting of 317,062,012 people shows a mild negative correlation between the proportion of Ecuadorians and percentage of population receiving government assistance and/or food stamps in the United States with a correlation coefficient (R) of -0.324 and weighted average of 14.9%. Similarly, the statistical analysis conducted on geographies consisting of 172,350,447 people shows no correlation between the proportion of Immigrants from Bulgaria and percentage of population receiving government assistance and/or food stamps in the United States with a correlation coefficient (R) of -0.014 and weighted average of 9.8%, a difference of 52.3%.
Receiving Food Stamps Correlation Summary
| Measurement | Ecuadorian | Immigrants from Bulgaria |
| Minimum | 0.20% | 2.6% |
| Maximum | 30.0% | 12.1% |
| Range | 29.8% | 9.5% |
| Mean | 13.1% | 7.0% |
| Median | 13.6% | 7.2% |
| Interquartile 25% (IQ1) | 9.6% | 5.6% |
| Interquartile 75% (IQ3) | 15.6% | 8.0% |
| Interquartile Range (IQR) | 6.0% | 2.4% |
| Standard Deviation (Sample) | 5.9% | 2.5% |
| Standard Deviation (Population) | 5.9% | 2.4% |
Similar Demographics by Receiving Food Stamps
Demographics Similar to Ecuadorians by Receiving Food Stamps
In terms of receiving food stamps, the demographic groups most similar to Ecuadorians are Kiowa (14.9%, a difference of 0.050%), Belizean (14.8%, a difference of 0.32%), Spanish American Indian (14.9%, a difference of 0.32%), Seminole (14.8%, a difference of 0.45%), and Liberian (14.8%, a difference of 0.50%).
| Demographics | Rating | Rank | Receiving Food Stamps |
| Alaskan Athabascans | 0.1 /100 | #273 | Tragic 14.7% |
| Immigrants | Western Africa | 0.1 /100 | #274 | Tragic 14.7% |
| Ute | 0.1 /100 | #275 | Tragic 14.7% |
| Liberians | 0.1 /100 | #276 | Tragic 14.8% |
| Seminole | 0.1 /100 | #277 | Tragic 14.8% |
| Belizeans | 0.1 /100 | #278 | Tragic 14.8% |
| Kiowa | 0.0 /100 | #279 | Tragic 14.9% |
| Ecuadorians | 0.0 /100 | #280 | Tragic 14.9% |
| Spanish American Indians | 0.0 /100 | #281 | Tragic 14.9% |
| Immigrants | Central America | 0.0 /100 | #282 | Tragic 15.0% |
| Bangladeshis | 0.0 /100 | #283 | Tragic 15.0% |
| Immigrants | Ecuador | 0.0 /100 | #284 | Tragic 15.0% |
| Immigrants | Liberia | 0.0 /100 | #285 | Tragic 15.1% |
| Africans | 0.0 /100 | #286 | Tragic 15.1% |
| Immigrants | Mexico | 0.0 /100 | #287 | Tragic 15.2% |
Demographics Similar to Immigrants from Bulgaria by Receiving Food Stamps
In terms of receiving food stamps, the demographic groups most similar to Immigrants from Bulgaria are Chinese (9.8%, a difference of 0.030%), English (9.8%, a difference of 0.080%), Immigrants from North America (9.8%, a difference of 0.12%), German (9.7%, a difference of 0.22%), and Immigrants from Turkey (9.8%, a difference of 0.28%).
| Demographics | Rating | Rank | Receiving Food Stamps |
| Immigrants | Switzerland | 99.3 /100 | #55 | Exceptional 9.7% |
| Immigrants | Canada | 99.3 /100 | #56 | Exceptional 9.7% |
| Greeks | 99.3 /100 | #57 | Exceptional 9.7% |
| Scandinavians | 99.2 /100 | #58 | Exceptional 9.7% |
| British | 99.2 /100 | #59 | Exceptional 9.7% |
| Germans | 99.2 /100 | #60 | Exceptional 9.7% |
| English | 99.2 /100 | #61 | Exceptional 9.8% |
| Immigrants | Bulgaria | 99.2 /100 | #62 | Exceptional 9.8% |
| Chinese | 99.2 /100 | #63 | Exceptional 9.8% |
| Immigrants | North America | 99.2 /100 | #64 | Exceptional 9.8% |
| Immigrants | Turkey | 99.1 /100 | #65 | Exceptional 9.8% |
| Slovenes | 99.1 /100 | #66 | Exceptional 9.8% |
| Immigrants | Indonesia | 99.0 /100 | #67 | Exceptional 9.8% |
| Northern Europeans | 99.0 /100 | #68 | Exceptional 9.8% |
| Italians | 99.0 /100 | #69 | Exceptional 9.9% |