Immigrants from Chile vs Welsh Male Poverty
COMPARE
Immigrants from Chile
Welsh
Male Poverty
Male Poverty Comparison
Immigrants from Chile
Welsh
11.1%
MALE POVERTY
57.4/ 100
METRIC RATING
162nd/ 347
METRIC RANK
10.5%
MALE POVERTY
91.6/ 100
METRIC RATING
104th/ 347
METRIC RANK
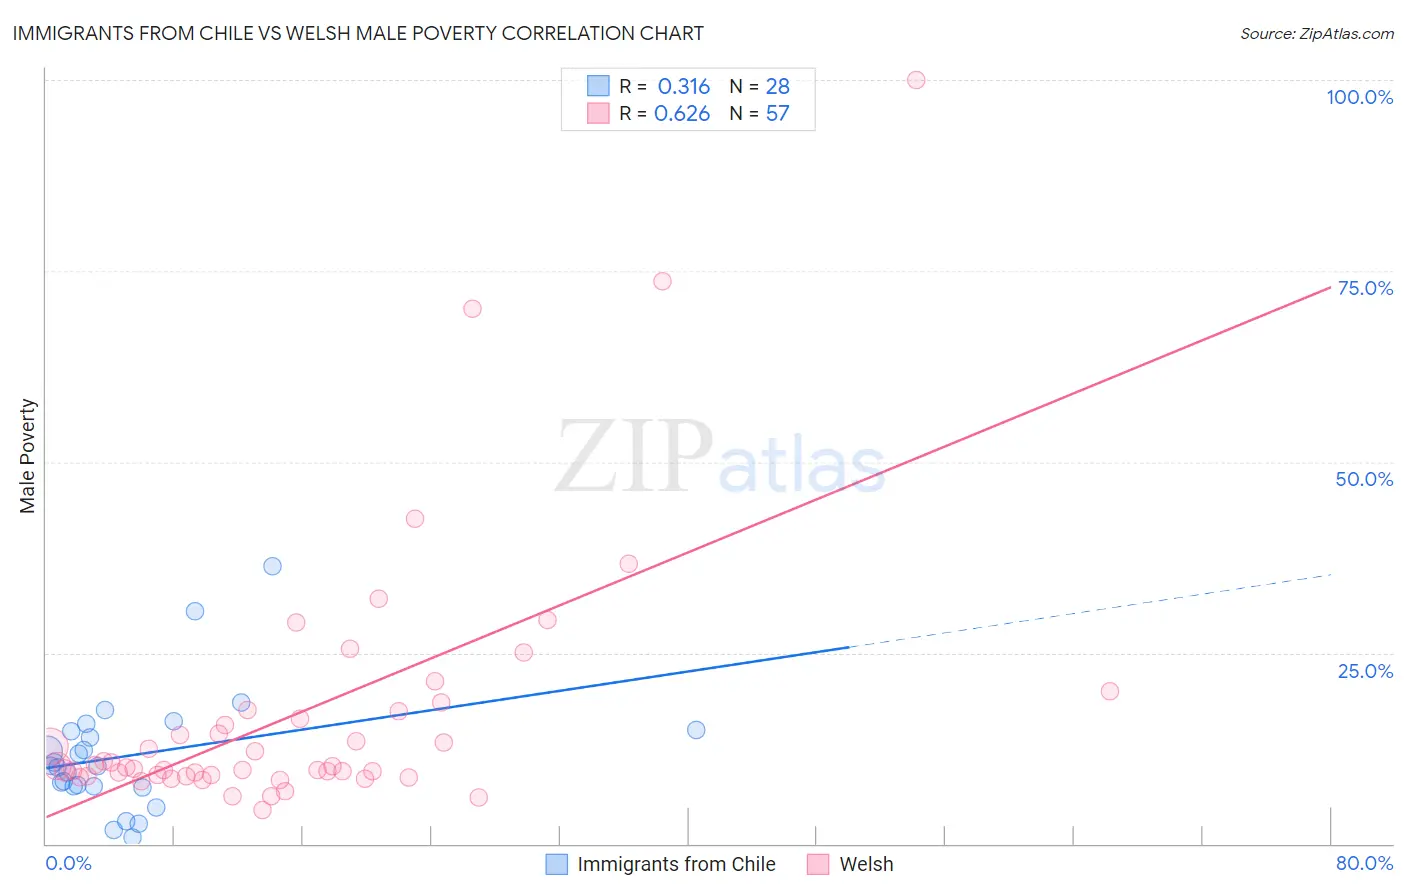
Immigrants from Chile vs Welsh Male Poverty Correlation Chart
The statistical analysis conducted on geographies consisting of 218,566,097 people shows a mild positive correlation between the proportion of Immigrants from Chile and poverty level among males in the United States with a correlation coefficient (R) of 0.316 and weighted average of 11.1%. Similarly, the statistical analysis conducted on geographies consisting of 527,618,308 people shows a significant positive correlation between the proportion of Welsh and poverty level among males in the United States with a correlation coefficient (R) of 0.626 and weighted average of 10.5%, a difference of 5.4%.
Male Poverty Correlation Summary
| Measurement | Immigrants from Chile | Welsh |
| Minimum | 0.80% | 4.4% |
| Maximum | 36.4% | 100.0% |
| Range | 35.6% | 95.6% |
| Mean | 11.6% | 17.1% |
| Median | 10.2% | 10.1% |
| Interquartile 25% (IQ1) | 7.5% | 9.0% |
| Interquartile 75% (IQ3) | 14.8% | 17.4% |
| Interquartile Range (IQR) | 7.2% | 8.5% |
| Standard Deviation (Sample) | 7.8% | 17.4% |
| Standard Deviation (Population) | 7.6% | 17.3% |
Similar Demographics by Male Poverty
Demographics Similar to Immigrants from Chile by Male Poverty
In terms of male poverty, the demographic groups most similar to Immigrants from Chile are White/Caucasian (11.1%, a difference of 0.060%), Ethiopian (11.1%, a difference of 0.070%), Immigrants from Spain (11.1%, a difference of 0.19%), Immigrants from Albania (11.1%, a difference of 0.21%), and Hungarian (11.1%, a difference of 0.22%).
| Demographics | Rating | Rank | Male Poverty |
| Immigrants | Malaysia | 64.7 /100 | #155 | Good 11.0% |
| Costa Ricans | 63.9 /100 | #156 | Good 11.0% |
| Scotch-Irish | 63.7 /100 | #157 | Good 11.0% |
| Colombians | 63.0 /100 | #158 | Good 11.0% |
| Taiwanese | 62.7 /100 | #159 | Good 11.0% |
| Soviet Union | 60.3 /100 | #160 | Good 11.1% |
| Immigrants | Northern Africa | 59.7 /100 | #161 | Average 11.1% |
| Immigrants | Chile | 57.4 /100 | #162 | Average 11.1% |
| Whites/Caucasians | 56.7 /100 | #163 | Average 11.1% |
| Ethiopians | 56.7 /100 | #164 | Average 11.1% |
| Immigrants | Spain | 55.5 /100 | #165 | Average 11.1% |
| Immigrants | Albania | 55.3 /100 | #166 | Average 11.1% |
| Hungarians | 55.1 /100 | #167 | Average 11.1% |
| Immigrants | Portugal | 54.9 /100 | #168 | Average 11.1% |
| Immigrants | Colombia | 54.2 /100 | #169 | Average 11.1% |
Demographics Similar to Welsh by Male Poverty
In terms of male poverty, the demographic groups most similar to Welsh are Slavic (10.5%, a difference of 0.010%), Canadian (10.5%, a difference of 0.010%), French Canadian (10.5%, a difference of 0.11%), Immigrants from Zimbabwe (10.5%, a difference of 0.12%), and Immigrants from Southern Europe (10.5%, a difference of 0.12%).
| Demographics | Rating | Rank | Male Poverty |
| Romanians | 93.6 /100 | #97 | Exceptional 10.5% |
| Finns | 93.4 /100 | #98 | Exceptional 10.5% |
| Immigrants | Indonesia | 93.3 /100 | #99 | Exceptional 10.5% |
| Immigrants | Latvia | 92.8 /100 | #100 | Exceptional 10.5% |
| Immigrants | Zimbabwe | 92.0 /100 | #101 | Exceptional 10.5% |
| French Canadians | 91.9 /100 | #102 | Exceptional 10.5% |
| Slavs | 91.7 /100 | #103 | Exceptional 10.5% |
| Welsh | 91.6 /100 | #104 | Exceptional 10.5% |
| Canadians | 91.6 /100 | #105 | Exceptional 10.5% |
| Immigrants | Southern Europe | 91.3 /100 | #106 | Exceptional 10.5% |
| Laotians | 91.2 /100 | #107 | Exceptional 10.5% |
| Portuguese | 91.0 /100 | #108 | Exceptional 10.6% |
| Albanians | 90.6 /100 | #109 | Exceptional 10.6% |
| Argentineans | 90.1 /100 | #110 | Exceptional 10.6% |
| Immigrants | Argentina | 89.8 /100 | #111 | Excellent 10.6% |