Immigrants from Burma/Myanmar vs Immigrants from Taiwan Male Poverty
COMPARE
Immigrants from Burma/Myanmar
Immigrants from Taiwan
Male Poverty
Male Poverty Comparison
Immigrants from Burma/Myanmar
Immigrants from Taiwan
13.0%
MALE POVERTY
0.1/ 100
METRIC RATING
256th/ 347
METRIC RANK
8.9%
MALE POVERTY
100.0/ 100
METRIC RATING
4th/ 347
METRIC RANK
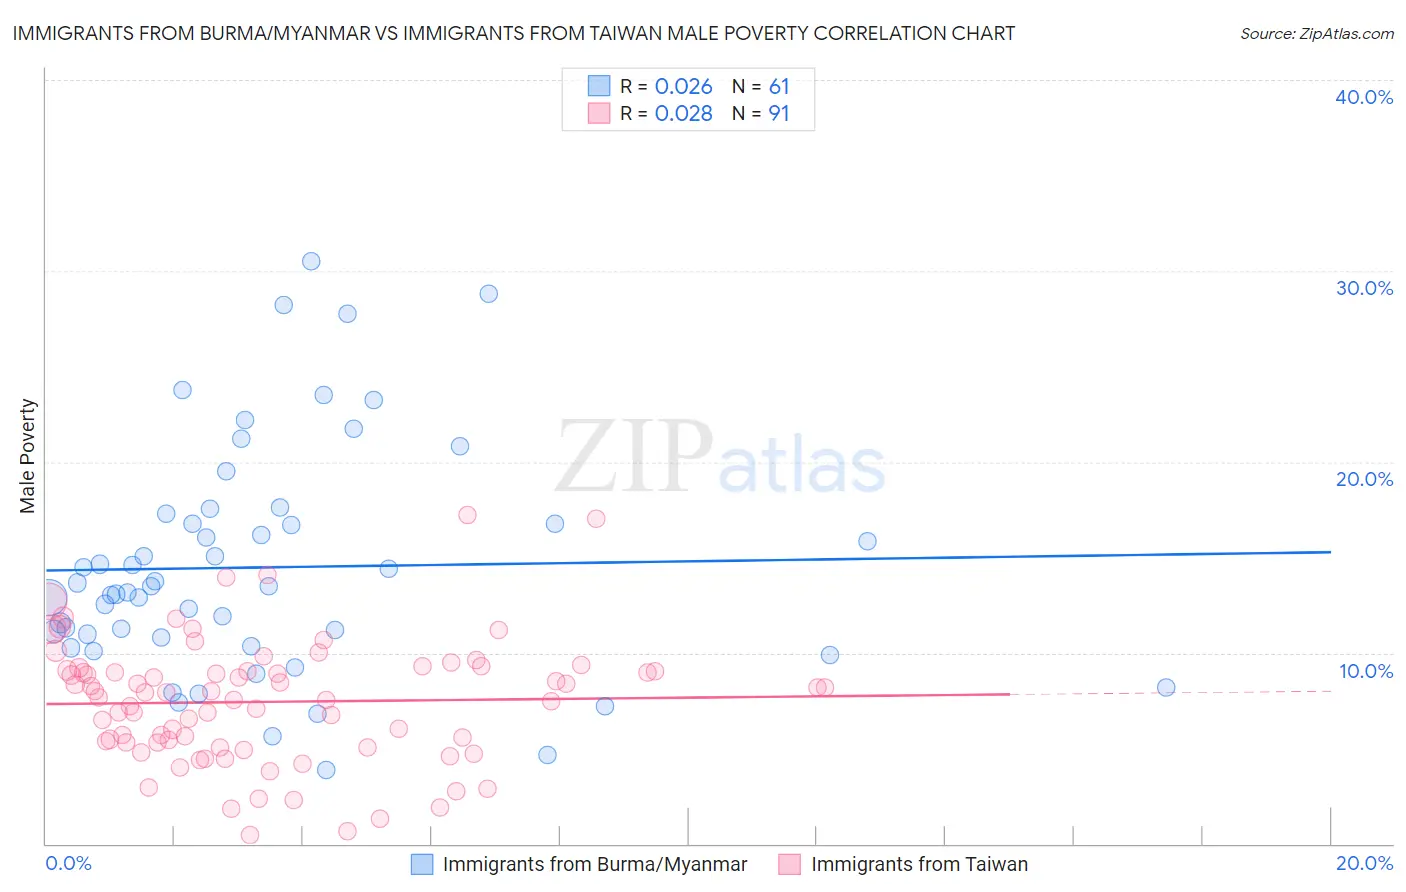
Immigrants from Burma/Myanmar vs Immigrants from Taiwan Male Poverty Correlation Chart
The statistical analysis conducted on geographies consisting of 172,258,093 people shows no correlation between the proportion of Immigrants from Burma/Myanmar and poverty level among males in the United States with a correlation coefficient (R) of 0.026 and weighted average of 13.0%. Similarly, the statistical analysis conducted on geographies consisting of 298,036,571 people shows no correlation between the proportion of Immigrants from Taiwan and poverty level among males in the United States with a correlation coefficient (R) of 0.028 and weighted average of 8.9%, a difference of 46.4%.
Male Poverty Correlation Summary
| Measurement | Immigrants from Burma/Myanmar | Immigrants from Taiwan |
| Minimum | 3.9% | 0.43% |
| Maximum | 30.5% | 17.2% |
| Range | 26.6% | 16.8% |
| Mean | 14.5% | 7.4% |
| Median | 13.5% | 7.9% |
| Interquartile 25% (IQ1) | 10.6% | 5.3% |
| Interquartile 75% (IQ3) | 17.0% | 9.1% |
| Interquartile Range (IQR) | 6.5% | 3.8% |
| Standard Deviation (Sample) | 6.0% | 3.2% |
| Standard Deviation (Population) | 5.9% | 3.2% |
Similar Demographics by Male Poverty
Demographics Similar to Immigrants from Burma/Myanmar by Male Poverty
In terms of male poverty, the demographic groups most similar to Immigrants from Burma/Myanmar are Immigrants from Liberia (13.0%, a difference of 0.20%), Immigrants from Trinidad and Tobago (13.1%, a difference of 0.26%), Mexican American Indian (13.0%, a difference of 0.29%), Cape Verdean (13.1%, a difference of 0.39%), and Cherokee (13.1%, a difference of 0.55%).
| Demographics | Rating | Rank | Male Poverty |
| Potawatomi | 0.2 /100 | #249 | Tragic 12.9% |
| Immigrants | Nicaragua | 0.2 /100 | #250 | Tragic 12.9% |
| Immigrants | Cuba | 0.2 /100 | #251 | Tragic 12.9% |
| Immigrants | Ecuador | 0.2 /100 | #252 | Tragic 12.9% |
| Immigrants | Ghana | 0.2 /100 | #253 | Tragic 12.9% |
| Mexican American Indians | 0.1 /100 | #254 | Tragic 13.0% |
| Immigrants | Liberia | 0.1 /100 | #255 | Tragic 13.0% |
| Immigrants | Burma/Myanmar | 0.1 /100 | #256 | Tragic 13.0% |
| Immigrants | Trinidad and Tobago | 0.1 /100 | #257 | Tragic 13.1% |
| Cape Verdeans | 0.1 /100 | #258 | Tragic 13.1% |
| Cherokee | 0.1 /100 | #259 | Tragic 13.1% |
| Ottawa | 0.1 /100 | #260 | Tragic 13.1% |
| Trinidadians and Tobagonians | 0.1 /100 | #261 | Tragic 13.1% |
| Spanish American Indians | 0.1 /100 | #262 | Tragic 13.1% |
| Central Americans | 0.1 /100 | #263 | Tragic 13.2% |
Demographics Similar to Immigrants from Taiwan by Male Poverty
In terms of male poverty, the demographic groups most similar to Immigrants from Taiwan are Maltese (9.1%, a difference of 2.0%), Thai (8.7%, a difference of 2.3%), Chinese (8.7%, a difference of 2.4%), Assyrian/Chaldean/Syriac (9.1%, a difference of 2.7%), and Immigrants from Ireland (9.1%, a difference of 2.7%).
| Demographics | Rating | Rank | Male Poverty |
| Immigrants | India | 100.0 /100 | #1 | Exceptional 8.2% |
| Chinese | 100.0 /100 | #2 | Exceptional 8.7% |
| Thais | 100.0 /100 | #3 | Exceptional 8.7% |
| Immigrants | Taiwan | 100.0 /100 | #4 | Exceptional 8.9% |
| Maltese | 100.0 /100 | #5 | Exceptional 9.1% |
| Assyrians/Chaldeans/Syriacs | 99.9 /100 | #6 | Exceptional 9.1% |
| Immigrants | Ireland | 99.9 /100 | #7 | Exceptional 9.1% |
| Filipinos | 99.9 /100 | #8 | Exceptional 9.2% |
| Immigrants | South Central Asia | 99.9 /100 | #9 | Exceptional 9.3% |
| Bulgarians | 99.9 /100 | #10 | Exceptional 9.3% |
| Bolivians | 99.9 /100 | #11 | Exceptional 9.4% |
| Immigrants | Bolivia | 99.9 /100 | #12 | Exceptional 9.4% |
| Immigrants | Lithuania | 99.9 /100 | #13 | Exceptional 9.4% |
| Immigrants | North Macedonia | 99.8 /100 | #14 | Exceptional 9.4% |
| Bhutanese | 99.8 /100 | #15 | Exceptional 9.5% |