Immigrants from Burma/Myanmar vs Native/Alaskan Seniors Poverty Over the Age of 75
COMPARE
Immigrants from Burma/Myanmar
Native/Alaskan
Seniors Poverty Over the Age of 75
Seniors Poverty Over the Age of 75 Comparison
Immigrants from Burma/Myanmar
Natives/Alaskans
12.1%
SENIORS POVERTY OVER THE AGE OF 75
62.3/ 100
METRIC RATING
156th/ 347
METRIC RANK
15.5%
SENIORS POVERTY OVER THE AGE OF 75
0.0/ 100
METRIC RATING
298th/ 347
METRIC RANK
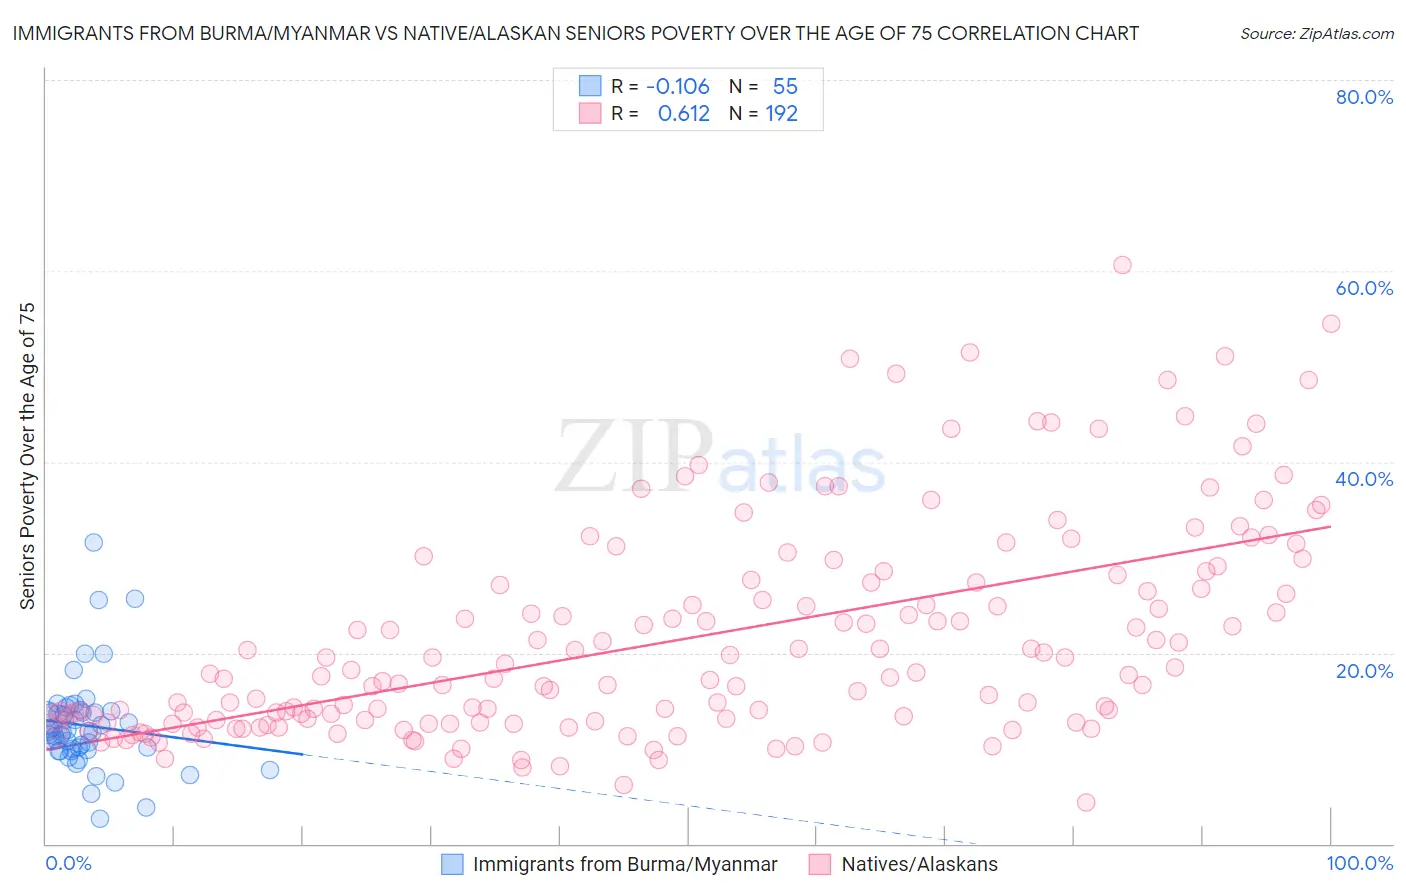
Immigrants from Burma/Myanmar vs Native/Alaskan Seniors Poverty Over the Age of 75 Correlation Chart
The statistical analysis conducted on geographies consisting of 171,617,389 people shows a poor negative correlation between the proportion of Immigrants from Burma/Myanmar and poverty level among seniors over the age of 75 in the United States with a correlation coefficient (R) of -0.106 and weighted average of 12.1%. Similarly, the statistical analysis conducted on geographies consisting of 503,579,334 people shows a significant positive correlation between the proportion of Natives/Alaskans and poverty level among seniors over the age of 75 in the United States with a correlation coefficient (R) of 0.612 and weighted average of 15.5%, a difference of 28.5%.
Seniors Poverty Over the Age of 75 Correlation Summary
| Measurement | Immigrants from Burma/Myanmar | Native/Alaskan |
| Minimum | 2.6% | 4.3% |
| Maximum | 31.5% | 60.7% |
| Range | 28.9% | 56.3% |
| Mean | 12.4% | 21.4% |
| Median | 11.8% | 17.5% |
| Interquartile 25% (IQ1) | 9.8% | 12.8% |
| Interquartile 75% (IQ3) | 13.8% | 27.3% |
| Interquartile Range (IQR) | 4.0% | 14.6% |
| Standard Deviation (Sample) | 5.0% | 11.2% |
| Standard Deviation (Population) | 4.9% | 11.2% |
Similar Demographics by Seniors Poverty Over the Age of 75
Demographics Similar to Immigrants from Burma/Myanmar by Seniors Poverty Over the Age of 75
In terms of seniors poverty over the age of 75, the demographic groups most similar to Immigrants from Burma/Myanmar are Indonesian (12.1%, a difference of 0.020%), Immigrants from Sudan (12.1%, a difference of 0.060%), Portuguese (12.1%, a difference of 0.090%), Immigrants from Middle Africa (12.1%, a difference of 0.10%), and Immigrants from Eastern Africa (12.1%, a difference of 0.13%).
| Demographics | Rating | Rank | Seniors Poverty Over the Age of 75 |
| Asians | 67.4 /100 | #149 | Good 12.0% |
| Cypriots | 67.3 /100 | #150 | Good 12.0% |
| Cherokee | 65.8 /100 | #151 | Good 12.0% |
| Immigrants | Korea | 65.5 /100 | #152 | Good 12.0% |
| Immigrants | Turkey | 64.7 /100 | #153 | Good 12.0% |
| Cambodians | 64.0 /100 | #154 | Good 12.0% |
| Indonesians | 62.6 /100 | #155 | Good 12.1% |
| Immigrants | Burma/Myanmar | 62.3 /100 | #156 | Good 12.1% |
| Immigrants | Sudan | 61.7 /100 | #157 | Good 12.1% |
| Portuguese | 61.3 /100 | #158 | Good 12.1% |
| Immigrants | Middle Africa | 61.2 /100 | #159 | Good 12.1% |
| Immigrants | Eastern Africa | 60.9 /100 | #160 | Good 12.1% |
| Immigrants | Norway | 60.6 /100 | #161 | Good 12.1% |
| Immigrants | Serbia | 60.2 /100 | #162 | Good 12.1% |
| Immigrants | Greece | 58.2 /100 | #163 | Average 12.1% |
Demographics Similar to Natives/Alaskans by Seniors Poverty Over the Age of 75
In terms of seniors poverty over the age of 75, the demographic groups most similar to Natives/Alaskans are Spanish American Indian (15.5%, a difference of 0.10%), Bahamian (15.5%, a difference of 0.11%), Honduran (15.4%, a difference of 0.34%), Yuman (15.4%, a difference of 0.62%), and U.S. Virgin Islander (15.4%, a difference of 0.80%).
| Demographics | Rating | Rank | Seniors Poverty Over the Age of 75 |
| Paiute | 0.0 /100 | #291 | Tragic 15.2% |
| Colville | 0.0 /100 | #292 | Tragic 15.2% |
| Apache | 0.0 /100 | #293 | Tragic 15.3% |
| Immigrants | Jamaica | 0.0 /100 | #294 | Tragic 15.3% |
| U.S. Virgin Islanders | 0.0 /100 | #295 | Tragic 15.4% |
| Yuman | 0.0 /100 | #296 | Tragic 15.4% |
| Hondurans | 0.0 /100 | #297 | Tragic 15.4% |
| Natives/Alaskans | 0.0 /100 | #298 | Tragic 15.5% |
| Spanish American Indians | 0.0 /100 | #299 | Tragic 15.5% |
| Bahamians | 0.0 /100 | #300 | Tragic 15.5% |
| Immigrants | Latin America | 0.0 /100 | #301 | Tragic 15.6% |
| West Indians | 0.0 /100 | #302 | Tragic 15.7% |
| Immigrants | Honduras | 0.0 /100 | #303 | Tragic 15.7% |
| Immigrants | Trinidad and Tobago | 0.0 /100 | #304 | Tragic 15.7% |
| Ecuadorians | 0.0 /100 | #305 | Tragic 15.7% |