Immigrants from Brazil vs Indonesian Receiving Food Stamps
COMPARE
Immigrants from Brazil
Indonesian
Receiving Food Stamps
Receiving Food Stamps Comparison
Immigrants from Brazil
Indonesians
10.8%
RECEIVING FOOD STAMPS
90.3/ 100
METRIC RATING
134th/ 347
METRIC RANK
13.9%
RECEIVING FOOD STAMPS
0.6/ 100
METRIC RATING
249th/ 347
METRIC RANK
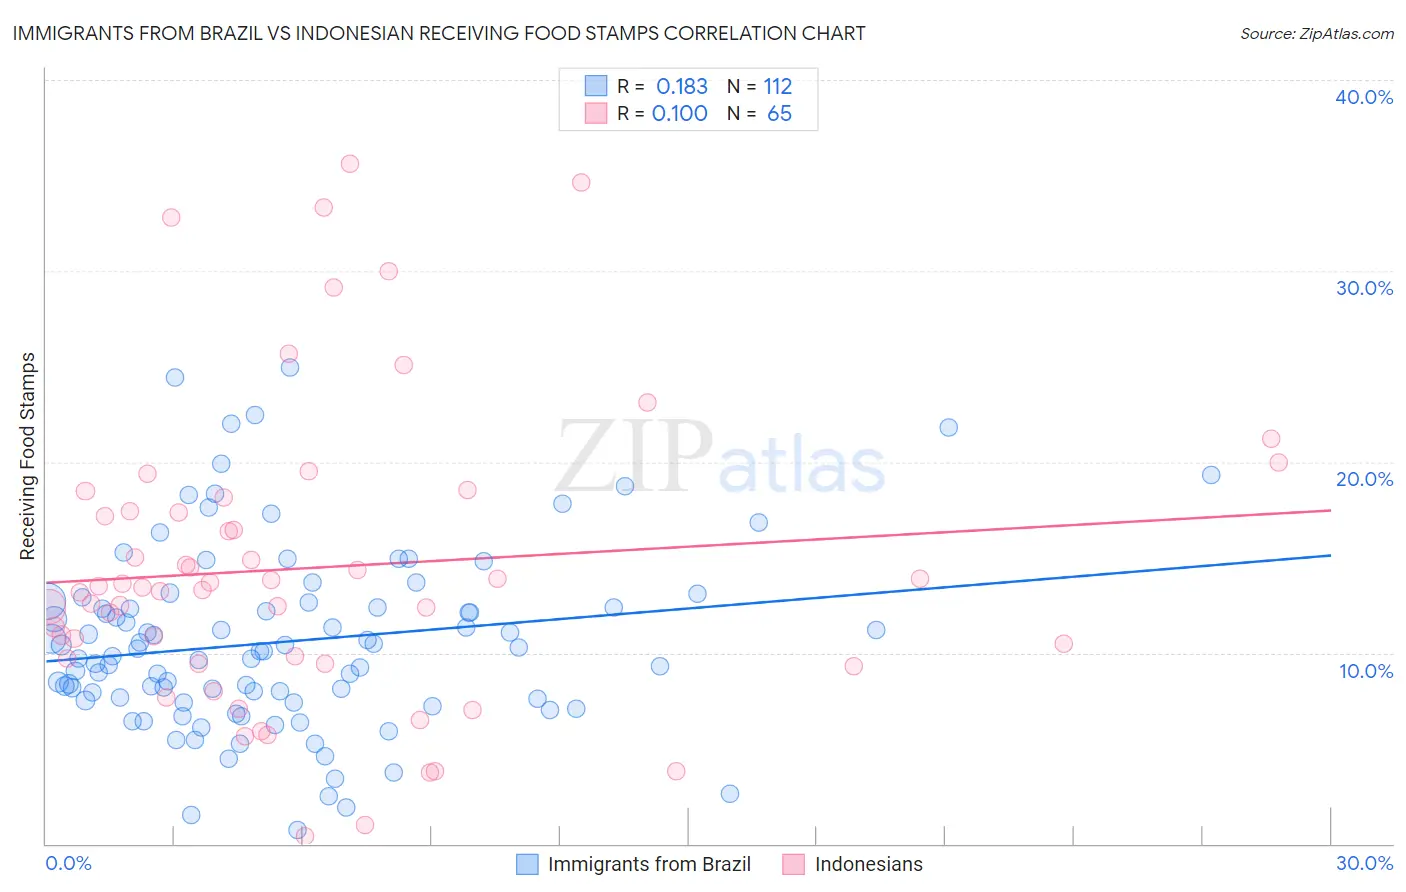
Immigrants from Brazil vs Indonesian Receiving Food Stamps Correlation Chart
The statistical analysis conducted on geographies consisting of 342,009,298 people shows a poor positive correlation between the proportion of Immigrants from Brazil and percentage of population receiving government assistance and/or food stamps in the United States with a correlation coefficient (R) of 0.183 and weighted average of 10.8%. Similarly, the statistical analysis conducted on geographies consisting of 162,471,591 people shows a poor positive correlation between the proportion of Indonesians and percentage of population receiving government assistance and/or food stamps in the United States with a correlation coefficient (R) of 0.100 and weighted average of 13.9%, a difference of 28.0%.
Receiving Food Stamps Correlation Summary
| Measurement | Immigrants from Brazil | Indonesian |
| Minimum | 0.70% | 0.40% |
| Maximum | 24.9% | 35.6% |
| Range | 24.2% | 35.2% |
| Mean | 10.6% | 14.5% |
| Median | 10.1% | 13.4% |
| Interquartile 25% (IQ1) | 7.6% | 9.6% |
| Interquartile 75% (IQ3) | 12.5% | 17.8% |
| Interquartile Range (IQR) | 4.9% | 8.2% |
| Standard Deviation (Sample) | 4.8% | 7.9% |
| Standard Deviation (Population) | 4.8% | 7.8% |
Similar Demographics by Receiving Food Stamps
Demographics Similar to Immigrants from Brazil by Receiving Food Stamps
In terms of receiving food stamps, the demographic groups most similar to Immigrants from Brazil are Argentinean (10.8%, a difference of 0.020%), Slovak (10.8%, a difference of 0.19%), Immigrants from Eastern Europe (10.8%, a difference of 0.21%), Immigrants from Russia (10.8%, a difference of 0.30%), and Immigrants from Moldova (10.9%, a difference of 0.72%).
| Demographics | Rating | Rank | Receiving Food Stamps |
| Immigrants | Ethiopia | 92.6 /100 | #127 | Exceptional 10.7% |
| Immigrants | Jordan | 92.5 /100 | #128 | Exceptional 10.7% |
| Yugoslavians | 92.5 /100 | #129 | Exceptional 10.7% |
| Israelis | 92.4 /100 | #130 | Exceptional 10.7% |
| French | 92.3 /100 | #131 | Exceptional 10.7% |
| Immigrants | Germany | 92.0 /100 | #132 | Exceptional 10.7% |
| Immigrants | Russia | 90.9 /100 | #133 | Exceptional 10.8% |
| Immigrants | Brazil | 90.3 /100 | #134 | Exceptional 10.8% |
| Argentineans | 90.2 /100 | #135 | Exceptional 10.8% |
| Slovaks | 89.8 /100 | #136 | Excellent 10.8% |
| Immigrants | Eastern Europe | 89.8 /100 | #137 | Excellent 10.8% |
| Immigrants | Moldova | 88.5 /100 | #138 | Excellent 10.9% |
| Hmong | 88.4 /100 | #139 | Excellent 10.9% |
| Celtics | 87.8 /100 | #140 | Excellent 10.9% |
| Immigrants | Vietnam | 86.7 /100 | #141 | Excellent 11.0% |
Demographics Similar to Indonesians by Receiving Food Stamps
In terms of receiving food stamps, the demographic groups most similar to Indonesians are Immigrants from Cambodia (13.9%, a difference of 0.17%), Yaqui (13.9%, a difference of 0.24%), Immigrants from Laos (13.8%, a difference of 0.63%), Ghanaian (14.0%, a difference of 0.69%), and Mexican American Indian (13.8%, a difference of 0.73%).
| Demographics | Rating | Rank | Receiving Food Stamps |
| Immigrants | Panama | 1.0 /100 | #242 | Tragic 13.6% |
| Somalis | 0.9 /100 | #243 | Tragic 13.7% |
| Cajuns | 0.9 /100 | #244 | Tragic 13.7% |
| Immigrants | Somalia | 0.9 /100 | #245 | Tragic 13.7% |
| Cree | 0.8 /100 | #246 | Tragic 13.7% |
| Mexican American Indians | 0.7 /100 | #247 | Tragic 13.8% |
| Immigrants | Laos | 0.7 /100 | #248 | Tragic 13.8% |
| Indonesians | 0.6 /100 | #249 | Tragic 13.9% |
| Immigrants | Cambodia | 0.5 /100 | #250 | Tragic 13.9% |
| Yaqui | 0.5 /100 | #251 | Tragic 13.9% |
| Ghanaians | 0.5 /100 | #252 | Tragic 14.0% |
| Spanish Americans | 0.4 /100 | #253 | Tragic 14.0% |
| Marshallese | 0.3 /100 | #254 | Tragic 14.1% |
| Sub-Saharan Africans | 0.3 /100 | #255 | Tragic 14.1% |
| Japanese | 0.3 /100 | #256 | Tragic 14.1% |