Immigrants from Brazil vs Potawatomi Female Poverty
COMPARE
Immigrants from Brazil
Potawatomi
Female Poverty
Female Poverty Comparison
Immigrants from Brazil
Potawatomi
12.8%
FEMALE POVERTY
87.9/ 100
METRIC RATING
129th/ 347
METRIC RANK
15.3%
FEMALE POVERTY
0.3/ 100
METRIC RATING
247th/ 347
METRIC RANK
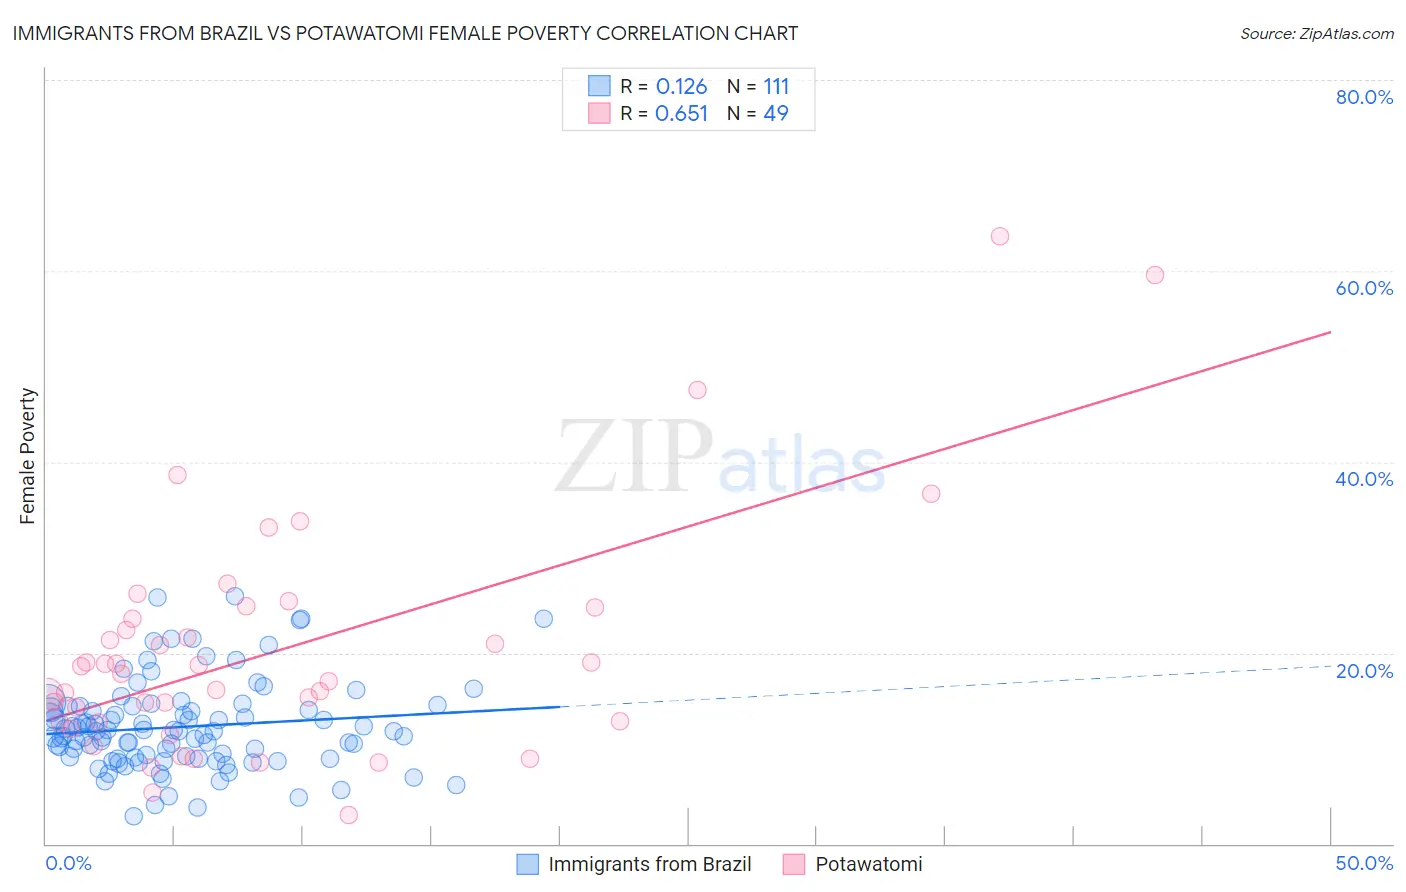
Immigrants from Brazil vs Potawatomi Female Poverty Correlation Chart
The statistical analysis conducted on geographies consisting of 342,799,416 people shows a poor positive correlation between the proportion of Immigrants from Brazil and poverty level among females in the United States with a correlation coefficient (R) of 0.126 and weighted average of 12.8%. Similarly, the statistical analysis conducted on geographies consisting of 117,742,920 people shows a significant positive correlation between the proportion of Potawatomi and poverty level among females in the United States with a correlation coefficient (R) of 0.651 and weighted average of 15.3%, a difference of 19.6%.
Female Poverty Correlation Summary
| Measurement | Immigrants from Brazil | Potawatomi |
| Minimum | 2.9% | 3.1% |
| Maximum | 25.9% | 63.6% |
| Range | 23.1% | 60.6% |
| Mean | 12.2% | 20.2% |
| Median | 11.8% | 17.8% |
| Interquartile 25% (IQ1) | 9.0% | 12.7% |
| Interquartile 75% (IQ3) | 14.5% | 24.2% |
| Interquartile Range (IQR) | 5.4% | 11.5% |
| Standard Deviation (Sample) | 4.6% | 12.3% |
| Standard Deviation (Population) | 4.6% | 12.2% |
Similar Demographics by Female Poverty
Demographics Similar to Immigrants from Brazil by Female Poverty
In terms of female poverty, the demographic groups most similar to Immigrants from Brazil are Immigrants from Belarus (12.8%, a difference of 0.070%), South African (12.8%, a difference of 0.11%), Immigrants from Vietnam (12.8%, a difference of 0.19%), Immigrants from Ukraine (12.8%, a difference of 0.22%), and Immigrants from Argentina (12.8%, a difference of 0.22%).
| Demographics | Rating | Rank | Female Poverty |
| French Canadians | 90.2 /100 | #122 | Exceptional 12.7% |
| Immigrants | South Eastern Asia | 89.9 /100 | #123 | Excellent 12.7% |
| Immigrants | Norway | 89.3 /100 | #124 | Excellent 12.8% |
| Argentineans | 89.1 /100 | #125 | Excellent 12.8% |
| Immigrants | Ukraine | 88.8 /100 | #126 | Excellent 12.8% |
| South Africans | 88.4 /100 | #127 | Excellent 12.8% |
| Immigrants | Belarus | 88.2 /100 | #128 | Excellent 12.8% |
| Immigrants | Brazil | 87.9 /100 | #129 | Excellent 12.8% |
| Immigrants | Vietnam | 87.1 /100 | #130 | Excellent 12.8% |
| Immigrants | Argentina | 87.0 /100 | #131 | Excellent 12.8% |
| Immigrants | Jordan | 86.9 /100 | #132 | Excellent 12.8% |
| Immigrants | Western Europe | 86.6 /100 | #133 | Excellent 12.8% |
| Immigrants | Switzerland | 85.8 /100 | #134 | Excellent 12.9% |
| French | 85.6 /100 | #135 | Excellent 12.9% |
| Peruvians | 85.2 /100 | #136 | Excellent 12.9% |
Demographics Similar to Potawatomi by Female Poverty
In terms of female poverty, the demographic groups most similar to Potawatomi are Immigrants from Ghana (15.3%, a difference of 0.0%), Cuban (15.3%, a difference of 0.010%), Spanish American Indian (15.3%, a difference of 0.060%), Salvadoran (15.3%, a difference of 0.14%), and Ecuadorian (15.3%, a difference of 0.16%).
| Demographics | Rating | Rank | Female Poverty |
| Sudanese | 0.5 /100 | #240 | Tragic 15.2% |
| Immigrants | Sudan | 0.4 /100 | #241 | Tragic 15.2% |
| Nepalese | 0.4 /100 | #242 | Tragic 15.2% |
| Nicaraguans | 0.3 /100 | #243 | Tragic 15.3% |
| Ecuadorians | 0.3 /100 | #244 | Tragic 15.3% |
| Spanish American Indians | 0.3 /100 | #245 | Tragic 15.3% |
| Cubans | 0.3 /100 | #246 | Tragic 15.3% |
| Potawatomi | 0.3 /100 | #247 | Tragic 15.3% |
| Immigrants | Ghana | 0.3 /100 | #248 | Tragic 15.3% |
| Salvadorans | 0.3 /100 | #249 | Tragic 15.3% |
| Immigrants | Western Africa | 0.3 /100 | #250 | Tragic 15.3% |
| Immigrants | Trinidad and Tobago | 0.3 /100 | #251 | Tragic 15.4% |
| Immigrants | Burma/Myanmar | 0.3 /100 | #252 | Tragic 15.4% |
| Liberians | 0.2 /100 | #253 | Tragic 15.4% |
| Trinidadians and Tobagonians | 0.2 /100 | #254 | Tragic 15.4% |