Immigrants from Brazil vs Immigrants from Germany Female Poverty
COMPARE
Immigrants from Brazil
Immigrants from Germany
Female Poverty
Female Poverty Comparison
Immigrants from Brazil
Immigrants from Germany
12.8%
FEMALE POVERTY
87.9/ 100
METRIC RATING
129th/ 347
METRIC RANK
13.1%
FEMALE POVERTY
74.9/ 100
METRIC RATING
151st/ 347
METRIC RANK
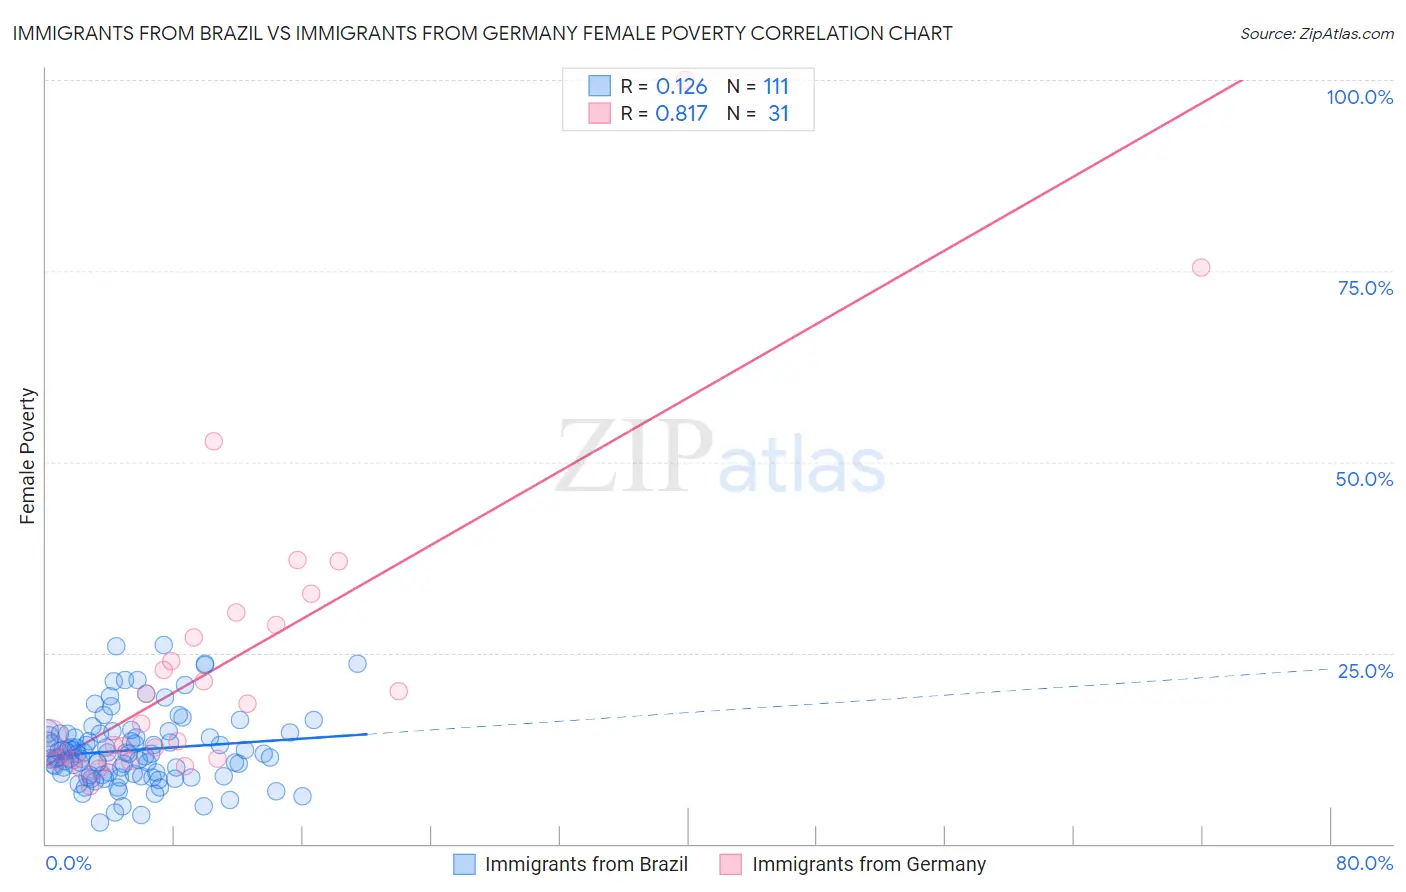
Immigrants from Brazil vs Immigrants from Germany Female Poverty Correlation Chart
The statistical analysis conducted on geographies consisting of 342,799,416 people shows a poor positive correlation between the proportion of Immigrants from Brazil and poverty level among females in the United States with a correlation coefficient (R) of 0.126 and weighted average of 12.8%. Similarly, the statistical analysis conducted on geographies consisting of 463,610,140 people shows a very strong positive correlation between the proportion of Immigrants from Germany and poverty level among females in the United States with a correlation coefficient (R) of 0.817 and weighted average of 13.1%, a difference of 2.2%.
Female Poverty Correlation Summary
| Measurement | Immigrants from Brazil | Immigrants from Germany |
| Minimum | 2.9% | 7.5% |
| Maximum | 25.9% | 100.0% |
| Range | 23.1% | 92.5% |
| Mean | 12.2% | 23.6% |
| Median | 11.8% | 15.7% |
| Interquartile 25% (IQ1) | 9.0% | 10.9% |
| Interquartile 75% (IQ3) | 14.5% | 28.6% |
| Interquartile Range (IQR) | 5.4% | 17.6% |
| Standard Deviation (Sample) | 4.6% | 20.3% |
| Standard Deviation (Population) | 4.6% | 20.0% |
Similar Demographics by Female Poverty
Demographics Similar to Immigrants from Brazil by Female Poverty
In terms of female poverty, the demographic groups most similar to Immigrants from Brazil are Immigrants from Belarus (12.8%, a difference of 0.070%), South African (12.8%, a difference of 0.11%), Immigrants from Vietnam (12.8%, a difference of 0.19%), Immigrants from Ukraine (12.8%, a difference of 0.22%), and Immigrants from Argentina (12.8%, a difference of 0.22%).
| Demographics | Rating | Rank | Female Poverty |
| French Canadians | 90.2 /100 | #122 | Exceptional 12.7% |
| Immigrants | South Eastern Asia | 89.9 /100 | #123 | Excellent 12.7% |
| Immigrants | Norway | 89.3 /100 | #124 | Excellent 12.8% |
| Argentineans | 89.1 /100 | #125 | Excellent 12.8% |
| Immigrants | Ukraine | 88.8 /100 | #126 | Excellent 12.8% |
| South Africans | 88.4 /100 | #127 | Excellent 12.8% |
| Immigrants | Belarus | 88.2 /100 | #128 | Excellent 12.8% |
| Immigrants | Brazil | 87.9 /100 | #129 | Excellent 12.8% |
| Immigrants | Vietnam | 87.1 /100 | #130 | Excellent 12.8% |
| Immigrants | Argentina | 87.0 /100 | #131 | Excellent 12.8% |
| Immigrants | Jordan | 86.9 /100 | #132 | Excellent 12.8% |
| Immigrants | Western Europe | 86.6 /100 | #133 | Excellent 12.8% |
| Immigrants | Switzerland | 85.8 /100 | #134 | Excellent 12.9% |
| French | 85.6 /100 | #135 | Excellent 12.9% |
| Peruvians | 85.2 /100 | #136 | Excellent 12.9% |
Demographics Similar to Immigrants from Germany by Female Poverty
In terms of female poverty, the demographic groups most similar to Immigrants from Germany are Tsimshian (13.1%, a difference of 0.070%), Taiwanese (13.1%, a difference of 0.10%), Samoan (13.1%, a difference of 0.17%), Yugoslavian (13.1%, a difference of 0.26%), and Immigrants from Fiji (13.2%, a difference of 0.49%).
| Demographics | Rating | Rank | Female Poverty |
| Afghans | 79.8 /100 | #144 | Good 13.0% |
| Syrians | 79.6 /100 | #145 | Good 13.0% |
| Immigrants | Peru | 79.1 /100 | #146 | Good 13.0% |
| Immigrants | Kazakhstan | 78.6 /100 | #147 | Good 13.0% |
| Yugoslavians | 76.9 /100 | #148 | Good 13.1% |
| Taiwanese | 75.7 /100 | #149 | Good 13.1% |
| Tsimshian | 75.5 /100 | #150 | Good 13.1% |
| Immigrants | Germany | 74.9 /100 | #151 | Good 13.1% |
| Samoans | 73.6 /100 | #152 | Good 13.1% |
| Immigrants | Fiji | 71.0 /100 | #153 | Good 13.2% |
| Armenians | 70.4 /100 | #154 | Good 13.2% |
| Hungarians | 70.1 /100 | #155 | Good 13.2% |
| Immigrants | Bosnia and Herzegovina | 69.7 /100 | #156 | Good 13.2% |
| Immigrants | Northern Africa | 68.8 /100 | #157 | Good 13.2% |
| Pennsylvania Germans | 67.3 /100 | #158 | Good 13.2% |