Immigrants from Brazil vs Bahamian Child Poverty Under the Age of 5
COMPARE
Immigrants from Brazil
Bahamian
Child Poverty Under the Age of 5
Child Poverty Under the Age of 5 Comparison
Immigrants from Brazil
Bahamians
16.0%
CHILD POVERTY UNDER THE AGE OF 5
94.4/ 100
METRIC RATING
108th/ 347
METRIC RANK
23.0%
CHILD POVERTY UNDER THE AGE OF 5
0.0/ 100
METRIC RATING
313th/ 347
METRIC RANK
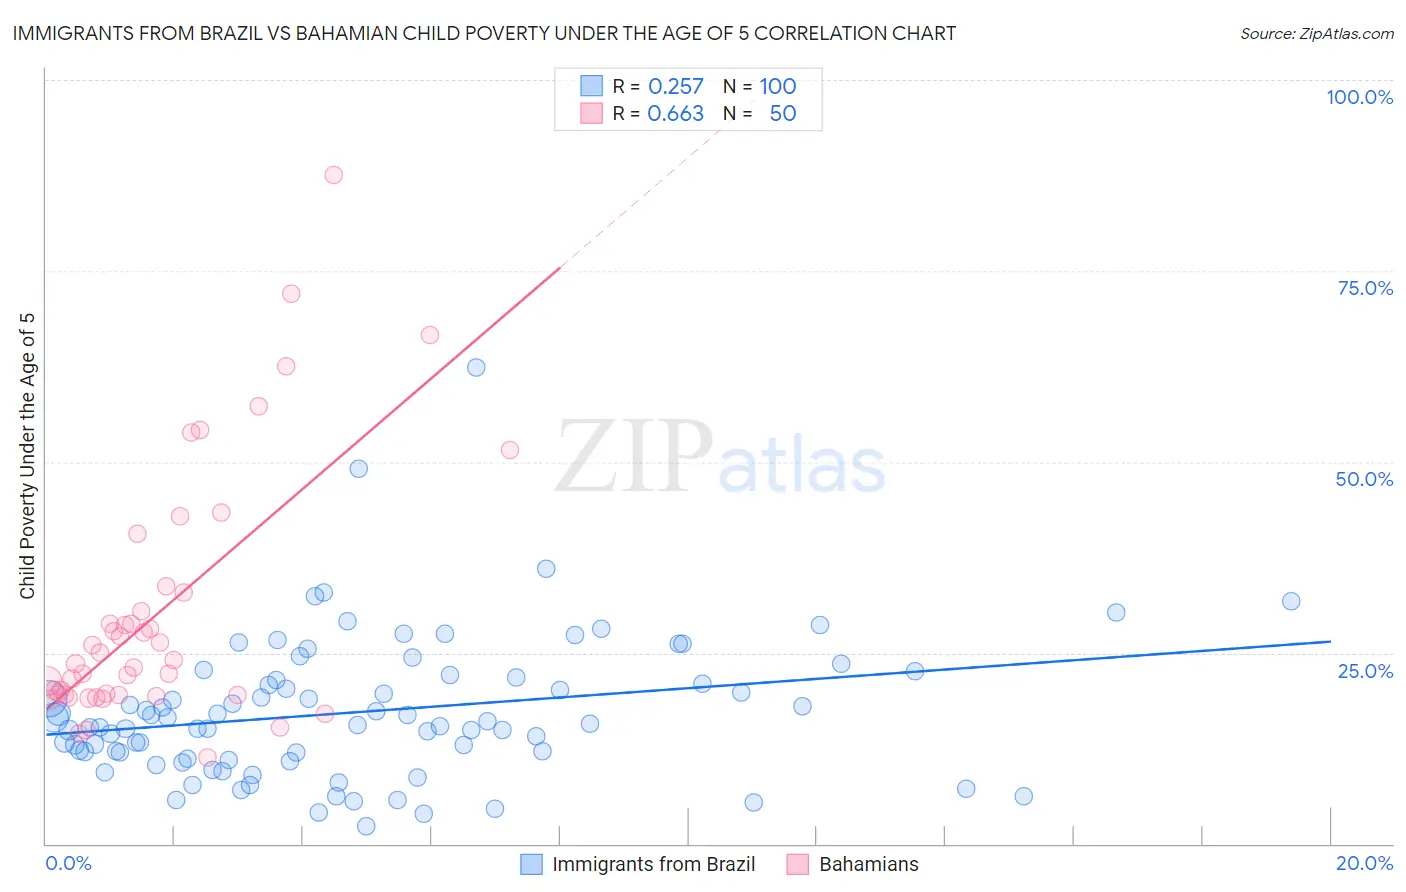
Immigrants from Brazil vs Bahamian Child Poverty Under the Age of 5 Correlation Chart
The statistical analysis conducted on geographies consisting of 329,337,051 people shows a weak positive correlation between the proportion of Immigrants from Brazil and poverty level among children under the age of 5 in the United States with a correlation coefficient (R) of 0.257 and weighted average of 16.0%. Similarly, the statistical analysis conducted on geographies consisting of 111,326,474 people shows a significant positive correlation between the proportion of Bahamians and poverty level among children under the age of 5 in the United States with a correlation coefficient (R) of 0.663 and weighted average of 23.0%, a difference of 43.9%.
Child Poverty Under the Age of 5 Correlation Summary
| Measurement | Immigrants from Brazil | Bahamian |
| Minimum | 2.3% | 11.3% |
| Maximum | 62.3% | 87.5% |
| Range | 60.0% | 76.2% |
| Mean | 17.3% | 30.2% |
| Median | 15.6% | 23.8% |
| Interquartile 25% (IQ1) | 11.5% | 19.5% |
| Interquartile 75% (IQ3) | 21.6% | 32.9% |
| Interquartile Range (IQR) | 10.1% | 13.4% |
| Standard Deviation (Sample) | 9.3% | 16.6% |
| Standard Deviation (Population) | 9.3% | 16.4% |
Similar Demographics by Child Poverty Under the Age of 5
Demographics Similar to Immigrants from Brazil by Child Poverty Under the Age of 5
In terms of child poverty under the age of 5, the demographic groups most similar to Immigrants from Brazil are Slovene (16.0%, a difference of 0.010%), Northern European (16.0%, a difference of 0.080%), Romanian (16.0%, a difference of 0.090%), Pakistani (16.0%, a difference of 0.12%), and Tlingit-Haida (15.9%, a difference of 0.16%).
| Demographics | Rating | Rank | Child Poverty Under the Age of 5 |
| Immigrants | Zimbabwe | 95.9 /100 | #101 | Exceptional 15.8% |
| Armenians | 95.7 /100 | #102 | Exceptional 15.8% |
| Europeans | 95.3 /100 | #103 | Exceptional 15.9% |
| Immigrants | North America | 94.9 /100 | #104 | Exceptional 15.9% |
| Immigrants | Spain | 94.8 /100 | #105 | Exceptional 15.9% |
| Tlingit-Haida | 94.7 /100 | #106 | Exceptional 15.9% |
| Slovenes | 94.4 /100 | #107 | Exceptional 16.0% |
| Immigrants | Brazil | 94.4 /100 | #108 | Exceptional 16.0% |
| Northern Europeans | 94.3 /100 | #109 | Exceptional 16.0% |
| Romanians | 94.3 /100 | #110 | Exceptional 16.0% |
| Pakistanis | 94.2 /100 | #111 | Exceptional 16.0% |
| Peruvians | 94.1 /100 | #112 | Exceptional 16.0% |
| Puget Sound Salish | 94.1 /100 | #113 | Exceptional 16.0% |
| Immigrants | Kuwait | 93.9 /100 | #114 | Exceptional 16.0% |
| Albanians | 93.8 /100 | #115 | Exceptional 16.0% |
Demographics Similar to Bahamians by Child Poverty Under the Age of 5
In terms of child poverty under the age of 5, the demographic groups most similar to Bahamians are Honduran (23.0%, a difference of 0.050%), U.S. Virgin Islander (23.0%, a difference of 0.090%), Seminole (22.8%, a difference of 0.65%), Arapaho (23.1%, a difference of 0.65%), and African (22.8%, a difference of 0.69%).
| Demographics | Rating | Rank | Child Poverty Under the Age of 5 |
| Indonesians | 0.0 /100 | #306 | Tragic 22.3% |
| Immigrants | Bahamas | 0.0 /100 | #307 | Tragic 22.7% |
| Immigrants | Dominica | 0.0 /100 | #308 | Tragic 22.7% |
| Houma | 0.0 /100 | #309 | Tragic 22.7% |
| Africans | 0.0 /100 | #310 | Tragic 22.8% |
| Seminole | 0.0 /100 | #311 | Tragic 22.8% |
| Hondurans | 0.0 /100 | #312 | Tragic 23.0% |
| Bahamians | 0.0 /100 | #313 | Tragic 23.0% |
| U.S. Virgin Islanders | 0.0 /100 | #314 | Tragic 23.0% |
| Arapaho | 0.0 /100 | #315 | Tragic 23.1% |
| Yakama | 0.0 /100 | #316 | Tragic 23.1% |
| Menominee | 0.0 /100 | #317 | Tragic 23.3% |
| Dutch West Indians | 0.0 /100 | #318 | Tragic 23.3% |
| Chippewa | 0.0 /100 | #319 | Tragic 23.4% |
| Choctaw | 0.0 /100 | #320 | Tragic 23.5% |