Potawatomi vs Bahamian Child Poverty Under the Age of 5
COMPARE
Potawatomi
Bahamian
Child Poverty Under the Age of 5
Child Poverty Under the Age of 5 Comparison
Potawatomi
Bahamians
21.0%
CHILD POVERTY UNDER THE AGE OF 5
0.0/ 100
METRIC RATING
282nd/ 347
METRIC RANK
23.0%
CHILD POVERTY UNDER THE AGE OF 5
0.0/ 100
METRIC RATING
313th/ 347
METRIC RANK
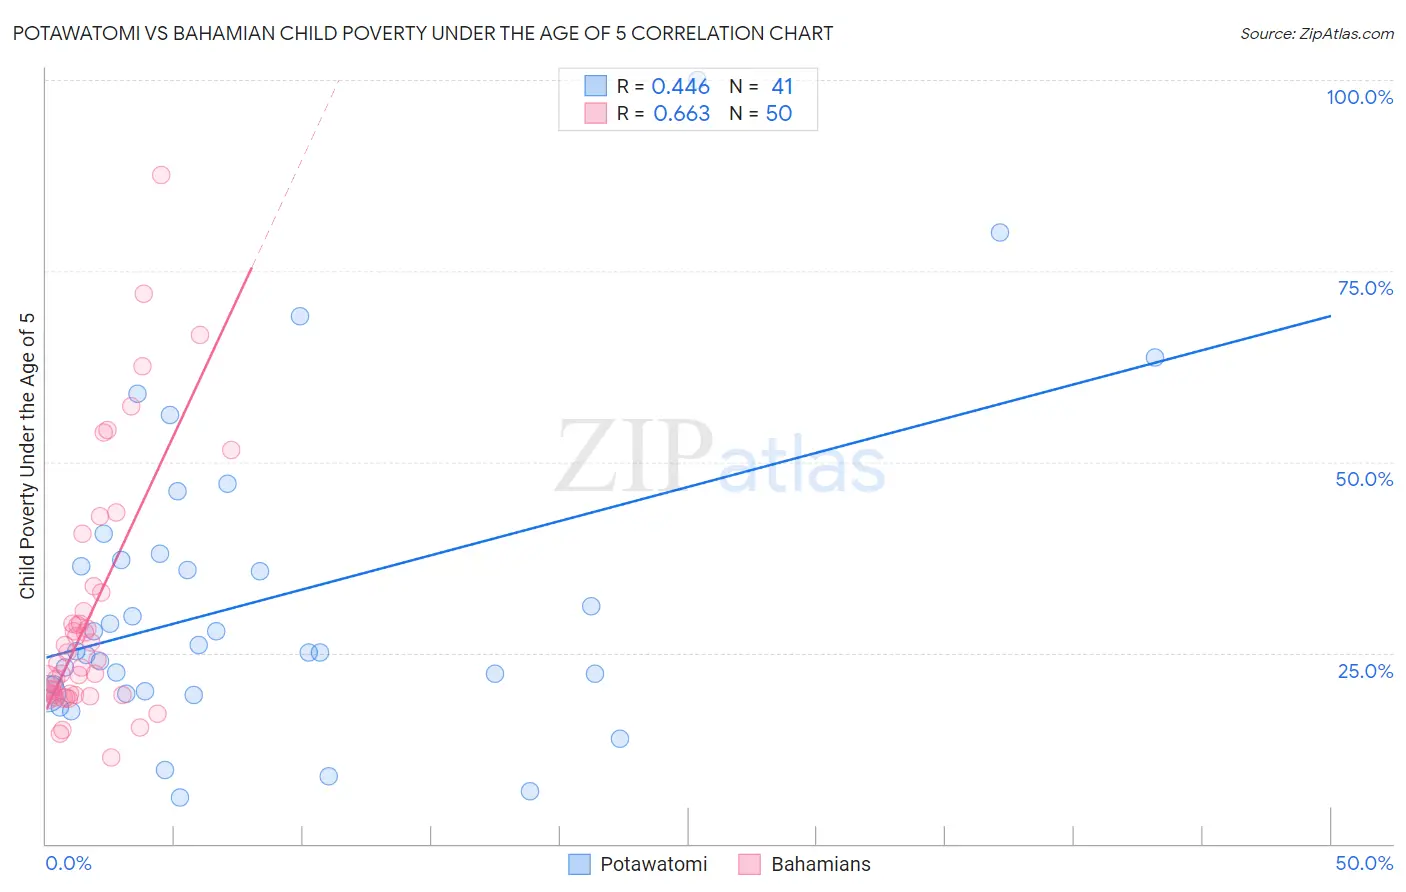
Potawatomi vs Bahamian Child Poverty Under the Age of 5 Correlation Chart
The statistical analysis conducted on geographies consisting of 116,008,403 people shows a moderate positive correlation between the proportion of Potawatomi and poverty level among children under the age of 5 in the United States with a correlation coefficient (R) of 0.446 and weighted average of 21.0%. Similarly, the statistical analysis conducted on geographies consisting of 111,326,474 people shows a significant positive correlation between the proportion of Bahamians and poverty level among children under the age of 5 in the United States with a correlation coefficient (R) of 0.663 and weighted average of 23.0%, a difference of 9.4%.
Child Poverty Under the Age of 5 Correlation Summary
| Measurement | Potawatomi | Bahamian |
| Minimum | 6.1% | 11.3% |
| Maximum | 100.0% | 87.5% |
| Range | 93.9% | 76.2% |
| Mean | 31.9% | 30.2% |
| Median | 25.1% | 23.8% |
| Interquartile 25% (IQ1) | 19.8% | 19.5% |
| Interquartile 75% (IQ3) | 37.6% | 32.9% |
| Interquartile Range (IQR) | 17.8% | 13.4% |
| Standard Deviation (Sample) | 19.8% | 16.6% |
| Standard Deviation (Population) | 19.6% | 16.4% |
Similar Demographics by Child Poverty Under the Age of 5
Demographics Similar to Potawatomi by Child Poverty Under the Age of 5
In terms of child poverty under the age of 5, the demographic groups most similar to Potawatomi are Comanche (21.0%, a difference of 0.20%), Somali (21.1%, a difference of 0.53%), Senegalese (20.9%, a difference of 0.54%), French American Indian (20.8%, a difference of 0.77%), and Haitian (21.2%, a difference of 1.0%).
| Demographics | Rating | Rank | Child Poverty Under the Age of 5 |
| Bangladeshis | 0.1 /100 | #275 | Tragic 20.6% |
| West Indians | 0.0 /100 | #276 | Tragic 20.6% |
| Immigrants | West Indies | 0.0 /100 | #277 | Tragic 20.7% |
| Immigrants | Grenada | 0.0 /100 | #278 | Tragic 20.7% |
| Sub-Saharan Africans | 0.0 /100 | #279 | Tragic 20.8% |
| French American Indians | 0.0 /100 | #280 | Tragic 20.8% |
| Senegalese | 0.0 /100 | #281 | Tragic 20.9% |
| Potawatomi | 0.0 /100 | #282 | Tragic 21.0% |
| Comanche | 0.0 /100 | #283 | Tragic 21.0% |
| Somalis | 0.0 /100 | #284 | Tragic 21.1% |
| Haitians | 0.0 /100 | #285 | Tragic 21.2% |
| Immigrants | Latin America | 0.0 /100 | #286 | Tragic 21.2% |
| Immigrants | Zaire | 0.0 /100 | #287 | Tragic 21.3% |
| Immigrants | Senegal | 0.0 /100 | #288 | Tragic 21.3% |
| Immigrants | Haiti | 0.0 /100 | #289 | Tragic 21.3% |
Demographics Similar to Bahamians by Child Poverty Under the Age of 5
In terms of child poverty under the age of 5, the demographic groups most similar to Bahamians are Honduran (23.0%, a difference of 0.050%), U.S. Virgin Islander (23.0%, a difference of 0.090%), Seminole (22.8%, a difference of 0.65%), Arapaho (23.1%, a difference of 0.65%), and African (22.8%, a difference of 0.69%).
| Demographics | Rating | Rank | Child Poverty Under the Age of 5 |
| Indonesians | 0.0 /100 | #306 | Tragic 22.3% |
| Immigrants | Bahamas | 0.0 /100 | #307 | Tragic 22.7% |
| Immigrants | Dominica | 0.0 /100 | #308 | Tragic 22.7% |
| Houma | 0.0 /100 | #309 | Tragic 22.7% |
| Africans | 0.0 /100 | #310 | Tragic 22.8% |
| Seminole | 0.0 /100 | #311 | Tragic 22.8% |
| Hondurans | 0.0 /100 | #312 | Tragic 23.0% |
| Bahamians | 0.0 /100 | #313 | Tragic 23.0% |
| U.S. Virgin Islanders | 0.0 /100 | #314 | Tragic 23.0% |
| Arapaho | 0.0 /100 | #315 | Tragic 23.1% |
| Yakama | 0.0 /100 | #316 | Tragic 23.1% |
| Menominee | 0.0 /100 | #317 | Tragic 23.3% |
| Dutch West Indians | 0.0 /100 | #318 | Tragic 23.3% |
| Chippewa | 0.0 /100 | #319 | Tragic 23.4% |
| Choctaw | 0.0 /100 | #320 | Tragic 23.5% |