Ukrainian vs Bahamian Child Poverty Under the Age of 5
COMPARE
Ukrainian
Bahamian
Child Poverty Under the Age of 5
Child Poverty Under the Age of 5 Comparison
Ukrainians
Bahamians
15.7%
CHILD POVERTY UNDER THE AGE OF 5
97.1/ 100
METRIC RATING
93rd/ 347
METRIC RANK
23.0%
CHILD POVERTY UNDER THE AGE OF 5
0.0/ 100
METRIC RATING
313th/ 347
METRIC RANK
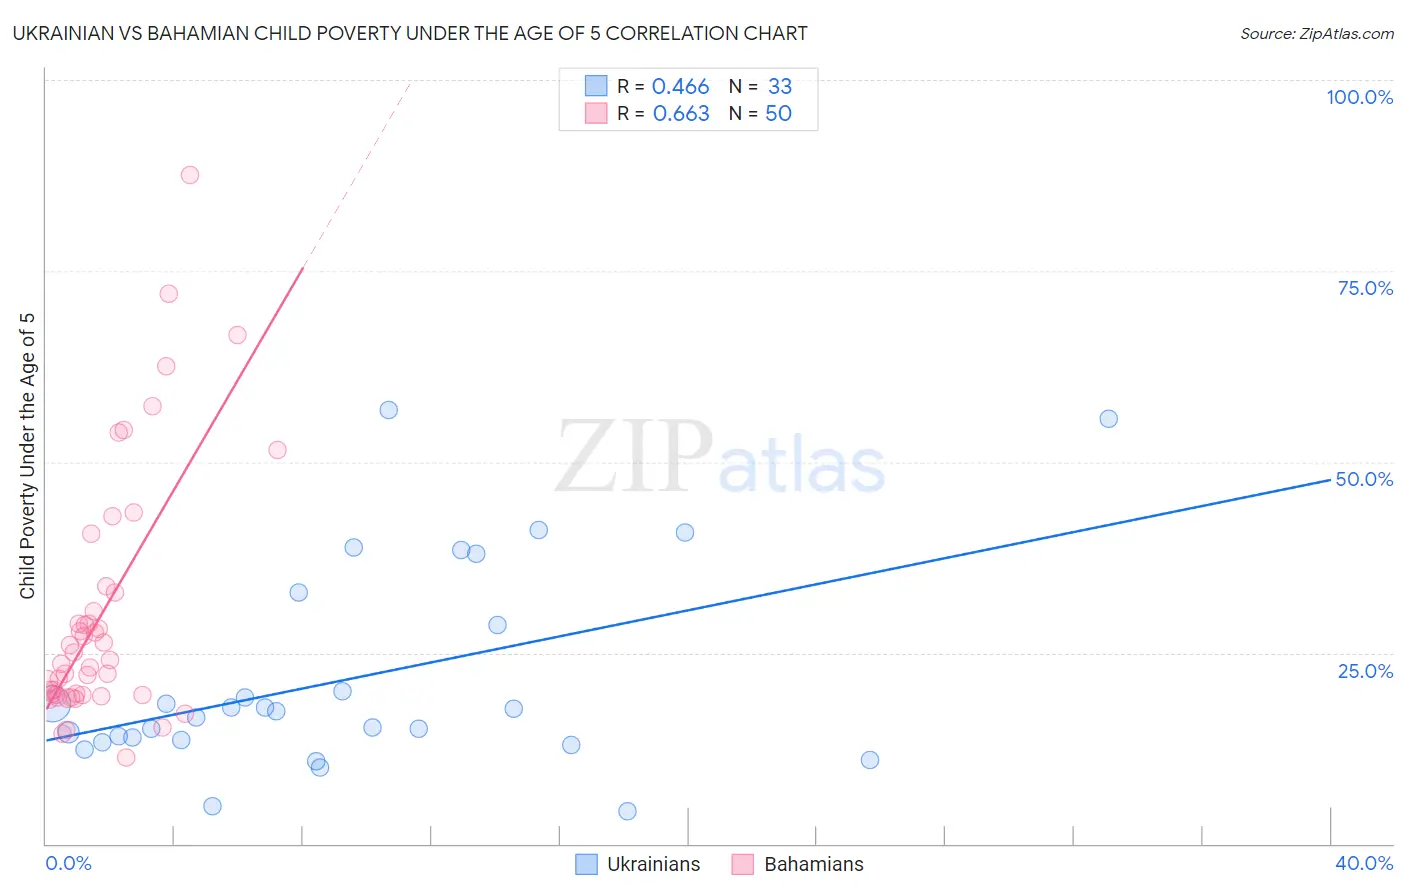
Ukrainian vs Bahamian Child Poverty Under the Age of 5 Correlation Chart
The statistical analysis conducted on geographies consisting of 423,070,264 people shows a moderate positive correlation between the proportion of Ukrainians and poverty level among children under the age of 5 in the United States with a correlation coefficient (R) of 0.466 and weighted average of 15.7%. Similarly, the statistical analysis conducted on geographies consisting of 111,326,474 people shows a significant positive correlation between the proportion of Bahamians and poverty level among children under the age of 5 in the United States with a correlation coefficient (R) of 0.663 and weighted average of 23.0%, a difference of 46.6%.
Child Poverty Under the Age of 5 Correlation Summary
| Measurement | Ukrainian | Bahamian |
| Minimum | 4.3% | 11.3% |
| Maximum | 56.8% | 87.5% |
| Range | 52.5% | 76.2% |
| Mean | 21.7% | 30.2% |
| Median | 17.3% | 23.8% |
| Interquartile 25% (IQ1) | 13.5% | 19.5% |
| Interquartile 75% (IQ3) | 30.7% | 32.9% |
| Interquartile Range (IQR) | 17.2% | 13.4% |
| Standard Deviation (Sample) | 13.5% | 16.6% |
| Standard Deviation (Population) | 13.3% | 16.4% |
Similar Demographics by Child Poverty Under the Age of 5
Demographics Similar to Ukrainians by Child Poverty Under the Age of 5
In terms of child poverty under the age of 5, the demographic groups most similar to Ukrainians are Scandinavian (15.7%, a difference of 0.020%), Immigrants from South Eastern Asia (15.7%, a difference of 0.020%), Polish (15.7%, a difference of 0.090%), Immigrants from Croatia (15.6%, a difference of 0.20%), and Immigrants from France (15.6%, a difference of 0.20%).
| Demographics | Rating | Rank | Child Poverty Under the Age of 5 |
| Immigrants | Malaysia | 97.4 /100 | #86 | Exceptional 15.6% |
| Immigrants | Vietnam | 97.4 /100 | #87 | Exceptional 15.6% |
| Jordanians | 97.3 /100 | #88 | Exceptional 15.6% |
| Immigrants | Croatia | 97.3 /100 | #89 | Exceptional 15.6% |
| Immigrants | France | 97.3 /100 | #90 | Exceptional 15.6% |
| Poles | 97.2 /100 | #91 | Exceptional 15.7% |
| Scandinavians | 97.1 /100 | #92 | Exceptional 15.7% |
| Ukrainians | 97.1 /100 | #93 | Exceptional 15.7% |
| Immigrants | South Eastern Asia | 97.1 /100 | #94 | Exceptional 15.7% |
| Immigrants | Switzerland | 96.4 /100 | #95 | Exceptional 15.8% |
| Immigrants | Kazakhstan | 96.2 /100 | #96 | Exceptional 15.8% |
| Macedonians | 96.2 /100 | #97 | Exceptional 15.8% |
| Immigrants | South Africa | 96.1 /100 | #98 | Exceptional 15.8% |
| Palestinians | 95.9 /100 | #99 | Exceptional 15.8% |
| Immigrants | Canada | 95.9 /100 | #100 | Exceptional 15.8% |
Demographics Similar to Bahamians by Child Poverty Under the Age of 5
In terms of child poverty under the age of 5, the demographic groups most similar to Bahamians are Honduran (23.0%, a difference of 0.050%), U.S. Virgin Islander (23.0%, a difference of 0.090%), Seminole (22.8%, a difference of 0.65%), Arapaho (23.1%, a difference of 0.65%), and African (22.8%, a difference of 0.69%).
| Demographics | Rating | Rank | Child Poverty Under the Age of 5 |
| Indonesians | 0.0 /100 | #306 | Tragic 22.3% |
| Immigrants | Bahamas | 0.0 /100 | #307 | Tragic 22.7% |
| Immigrants | Dominica | 0.0 /100 | #308 | Tragic 22.7% |
| Houma | 0.0 /100 | #309 | Tragic 22.7% |
| Africans | 0.0 /100 | #310 | Tragic 22.8% |
| Seminole | 0.0 /100 | #311 | Tragic 22.8% |
| Hondurans | 0.0 /100 | #312 | Tragic 23.0% |
| Bahamians | 0.0 /100 | #313 | Tragic 23.0% |
| U.S. Virgin Islanders | 0.0 /100 | #314 | Tragic 23.0% |
| Arapaho | 0.0 /100 | #315 | Tragic 23.1% |
| Yakama | 0.0 /100 | #316 | Tragic 23.1% |
| Menominee | 0.0 /100 | #317 | Tragic 23.3% |
| Dutch West Indians | 0.0 /100 | #318 | Tragic 23.3% |
| Chippewa | 0.0 /100 | #319 | Tragic 23.4% |
| Choctaw | 0.0 /100 | #320 | Tragic 23.5% |