Immigrants from Brazil vs Vietnamese Child Poverty Under the Age of 5
COMPARE
Immigrants from Brazil
Vietnamese
Child Poverty Under the Age of 5
Child Poverty Under the Age of 5 Comparison
Immigrants from Brazil
Vietnamese
16.0%
CHILD POVERTY UNDER THE AGE OF 5
94.4/ 100
METRIC RATING
108th/ 347
METRIC RANK
19.5%
CHILD POVERTY UNDER THE AGE OF 5
0.6/ 100
METRIC RATING
239th/ 347
METRIC RANK
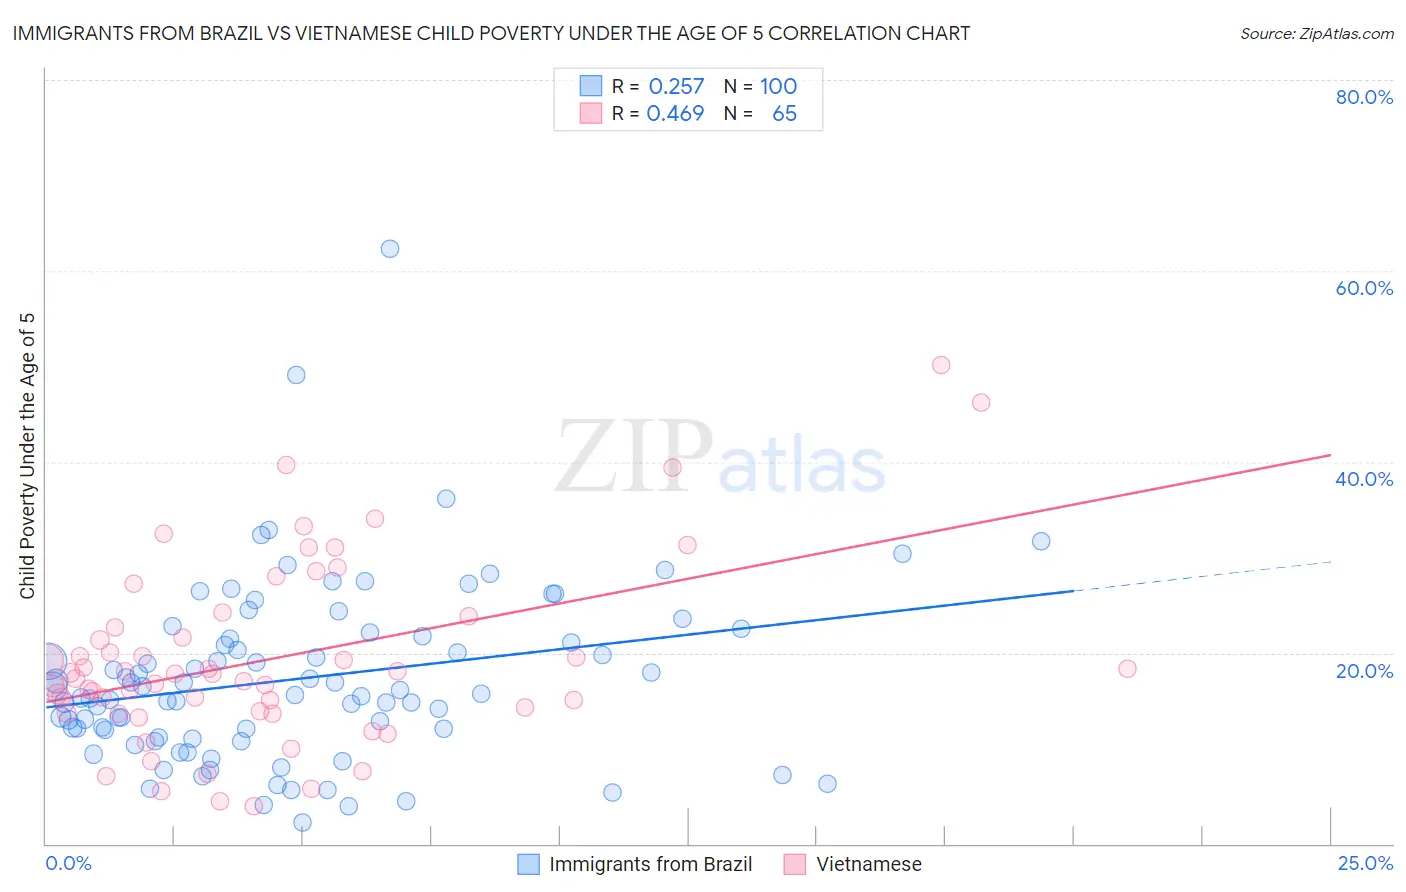
Immigrants from Brazil vs Vietnamese Child Poverty Under the Age of 5 Correlation Chart
The statistical analysis conducted on geographies consisting of 329,337,051 people shows a weak positive correlation between the proportion of Immigrants from Brazil and poverty level among children under the age of 5 in the United States with a correlation coefficient (R) of 0.257 and weighted average of 16.0%. Similarly, the statistical analysis conducted on geographies consisting of 167,363,305 people shows a moderate positive correlation between the proportion of Vietnamese and poverty level among children under the age of 5 in the United States with a correlation coefficient (R) of 0.469 and weighted average of 19.5%, a difference of 22.2%.
Child Poverty Under the Age of 5 Correlation Summary
| Measurement | Immigrants from Brazil | Vietnamese |
| Minimum | 2.3% | 3.9% |
| Maximum | 62.3% | 50.1% |
| Range | 60.0% | 46.2% |
| Mean | 17.3% | 19.4% |
| Median | 15.6% | 17.9% |
| Interquartile 25% (IQ1) | 11.5% | 13.8% |
| Interquartile 75% (IQ3) | 21.6% | 23.3% |
| Interquartile Range (IQR) | 10.1% | 9.5% |
| Standard Deviation (Sample) | 9.3% | 9.6% |
| Standard Deviation (Population) | 9.3% | 9.5% |
Similar Demographics by Child Poverty Under the Age of 5
Demographics Similar to Immigrants from Brazil by Child Poverty Under the Age of 5
In terms of child poverty under the age of 5, the demographic groups most similar to Immigrants from Brazil are Slovene (16.0%, a difference of 0.010%), Northern European (16.0%, a difference of 0.080%), Romanian (16.0%, a difference of 0.090%), Pakistani (16.0%, a difference of 0.12%), and Tlingit-Haida (15.9%, a difference of 0.16%).
| Demographics | Rating | Rank | Child Poverty Under the Age of 5 |
| Immigrants | Zimbabwe | 95.9 /100 | #101 | Exceptional 15.8% |
| Armenians | 95.7 /100 | #102 | Exceptional 15.8% |
| Europeans | 95.3 /100 | #103 | Exceptional 15.9% |
| Immigrants | North America | 94.9 /100 | #104 | Exceptional 15.9% |
| Immigrants | Spain | 94.8 /100 | #105 | Exceptional 15.9% |
| Tlingit-Haida | 94.7 /100 | #106 | Exceptional 15.9% |
| Slovenes | 94.4 /100 | #107 | Exceptional 16.0% |
| Immigrants | Brazil | 94.4 /100 | #108 | Exceptional 16.0% |
| Northern Europeans | 94.3 /100 | #109 | Exceptional 16.0% |
| Romanians | 94.3 /100 | #110 | Exceptional 16.0% |
| Pakistanis | 94.2 /100 | #111 | Exceptional 16.0% |
| Peruvians | 94.1 /100 | #112 | Exceptional 16.0% |
| Puget Sound Salish | 94.1 /100 | #113 | Exceptional 16.0% |
| Immigrants | Kuwait | 93.9 /100 | #114 | Exceptional 16.0% |
| Albanians | 93.8 /100 | #115 | Exceptional 16.0% |
Demographics Similar to Vietnamese by Child Poverty Under the Age of 5
In terms of child poverty under the age of 5, the demographic groups most similar to Vietnamese are Salvadoran (19.5%, a difference of 0.020%), Immigrants from Cabo Verde (19.5%, a difference of 0.040%), Immigrants from Ecuador (19.6%, a difference of 0.37%), Alaska Native (19.6%, a difference of 0.44%), and Immigrants from Guyana (19.6%, a difference of 0.55%).
| Demographics | Rating | Rank | Child Poverty Under the Age of 5 |
| Trinidadians and Tobagonians | 0.9 /100 | #232 | Tragic 19.3% |
| Sudanese | 0.9 /100 | #233 | Tragic 19.3% |
| Immigrants | Micronesia | 0.9 /100 | #234 | Tragic 19.4% |
| Immigrants | Laos | 0.8 /100 | #235 | Tragic 19.4% |
| Immigrants | Trinidad and Tobago | 0.8 /100 | #236 | Tragic 19.4% |
| Immigrants | Cabo Verde | 0.6 /100 | #237 | Tragic 19.5% |
| Salvadorans | 0.6 /100 | #238 | Tragic 19.5% |
| Vietnamese | 0.6 /100 | #239 | Tragic 19.5% |
| Immigrants | Ecuador | 0.5 /100 | #240 | Tragic 19.6% |
| Alaska Natives | 0.5 /100 | #241 | Tragic 19.6% |
| Immigrants | Guyana | 0.5 /100 | #242 | Tragic 19.6% |
| Osage | 0.5 /100 | #243 | Tragic 19.6% |
| Immigrants | Ghana | 0.5 /100 | #244 | Tragic 19.6% |
| Immigrants | Western Africa | 0.4 /100 | #245 | Tragic 19.7% |
| Cree | 0.4 /100 | #246 | Tragic 19.7% |