Immigrants from Belize vs Panamanian Married-Couple Family Poverty
COMPARE
Immigrants from Belize
Panamanian
Married-Couple Family Poverty
Married-Couple Family Poverty Comparison
Immigrants from Belize
Panamanians
6.7%
MARRIED-COUPLE FAMILY POVERTY
0.0/ 100
METRIC RATING
300th/ 347
METRIC RANK
5.6%
MARRIED-COUPLE FAMILY POVERTY
9.2/ 100
METRIC RATING
221st/ 347
METRIC RANK
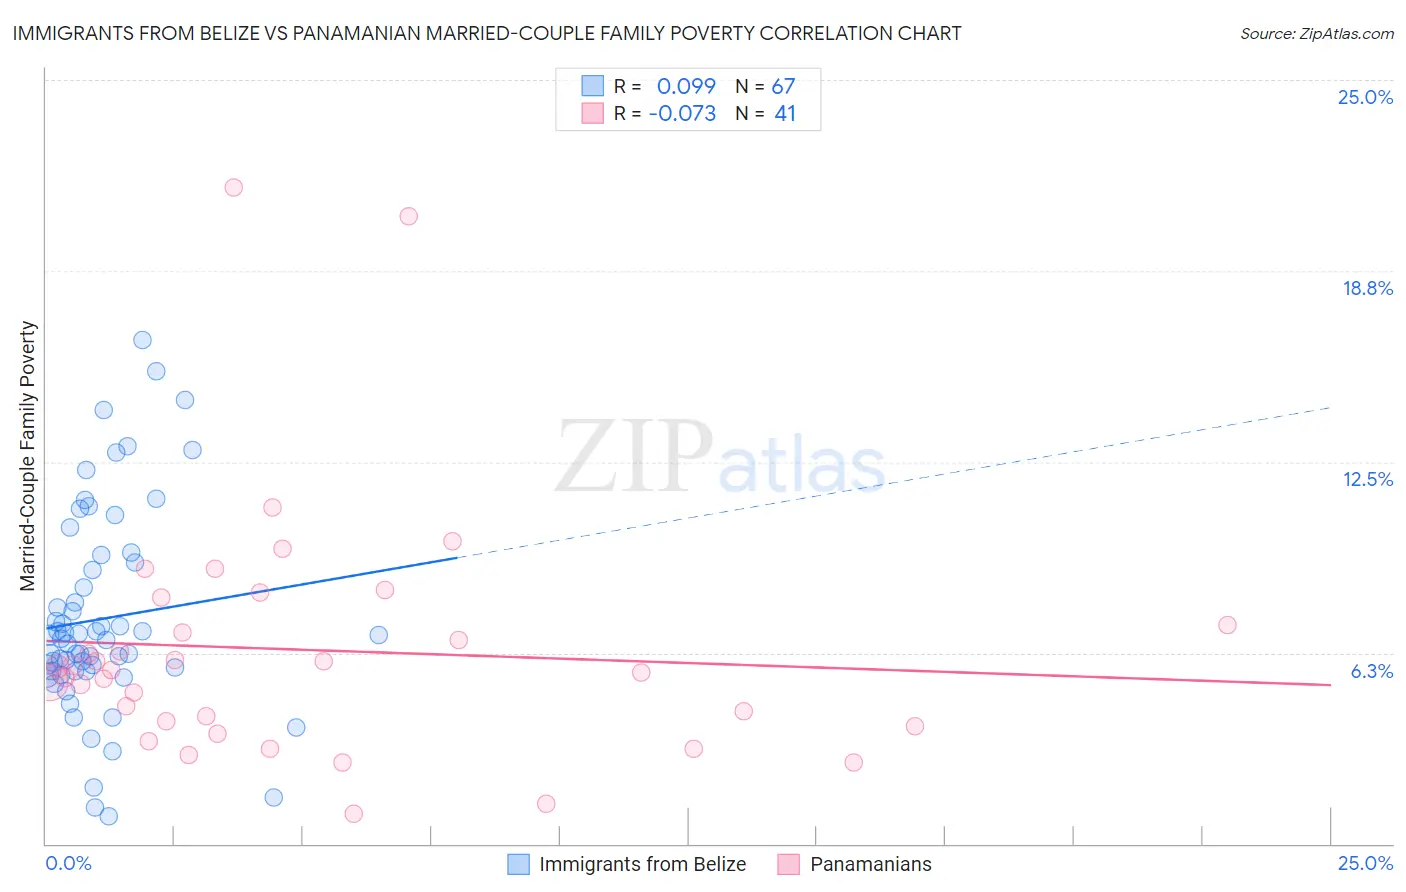
Immigrants from Belize vs Panamanian Married-Couple Family Poverty Correlation Chart
The statistical analysis conducted on geographies consisting of 130,147,118 people shows a slight positive correlation between the proportion of Immigrants from Belize and poverty level among married-couple families in the United States with a correlation coefficient (R) of 0.099 and weighted average of 6.7%. Similarly, the statistical analysis conducted on geographies consisting of 279,759,434 people shows a slight negative correlation between the proportion of Panamanians and poverty level among married-couple families in the United States with a correlation coefficient (R) of -0.073 and weighted average of 5.6%, a difference of 20.3%.
Married-Couple Family Poverty Correlation Summary
| Measurement | Immigrants from Belize | Panamanian |
| Minimum | 0.90% | 0.96% |
| Maximum | 16.5% | 21.5% |
| Range | 15.6% | 20.5% |
| Mean | 7.4% | 6.3% |
| Median | 6.7% | 5.7% |
| Interquartile 25% (IQ1) | 5.6% | 3.9% |
| Interquartile 75% (IQ3) | 9.2% | 7.6% |
| Interquartile Range (IQR) | 3.6% | 3.7% |
| Standard Deviation (Sample) | 3.3% | 4.1% |
| Standard Deviation (Population) | 3.3% | 4.0% |
Similar Demographics by Married-Couple Family Poverty
Demographics Similar to Immigrants from Belize by Married-Couple Family Poverty
In terms of married-couple family poverty, the demographic groups most similar to Immigrants from Belize are Nicaraguan (6.7%, a difference of 0.15%), Central American (6.7%, a difference of 0.60%), Immigrants from Guyana (6.7%, a difference of 0.69%), Immigrants from Ecuador (6.7%, a difference of 0.74%), and Kiowa (6.6%, a difference of 0.76%).
| Demographics | Rating | Rank | Married-Couple Family Poverty |
| Arapaho | 0.0 /100 | #293 | Tragic 6.6% |
| Bahamians | 0.0 /100 | #294 | Tragic 6.6% |
| Immigrants | Uzbekistan | 0.0 /100 | #295 | Tragic 6.6% |
| U.S. Virgin Islanders | 0.0 /100 | #296 | Tragic 6.6% |
| Kiowa | 0.0 /100 | #297 | Tragic 6.6% |
| Immigrants | Guyana | 0.0 /100 | #298 | Tragic 6.7% |
| Nicaraguans | 0.0 /100 | #299 | Tragic 6.7% |
| Immigrants | Belize | 0.0 /100 | #300 | Tragic 6.7% |
| Central Americans | 0.0 /100 | #301 | Tragic 6.7% |
| Immigrants | Ecuador | 0.0 /100 | #302 | Tragic 6.7% |
| Immigrants | El Salvador | 0.0 /100 | #303 | Tragic 6.8% |
| Cubans | 0.0 /100 | #304 | Tragic 6.8% |
| Haitians | 0.0 /100 | #305 | Tragic 6.8% |
| Immigrants | Haiti | 0.0 /100 | #306 | Tragic 7.0% |
| Guatemalans | 0.0 /100 | #307 | Tragic 7.0% |
Demographics Similar to Panamanians by Married-Couple Family Poverty
In terms of married-couple family poverty, the demographic groups most similar to Panamanians are Colombian (5.6%, a difference of 0.020%), Japanese (5.6%, a difference of 0.21%), Afghan (5.5%, a difference of 0.61%), Immigrants from Nigeria (5.5%, a difference of 0.63%), and Cajun (5.6%, a difference of 0.85%).
| Demographics | Rating | Rank | Married-Couple Family Poverty |
| Iroquois | 13.1 /100 | #214 | Poor 5.5% |
| Armenians | 12.8 /100 | #215 | Poor 5.5% |
| Potawatomi | 12.4 /100 | #216 | Poor 5.5% |
| Immigrants | Nigeria | 11.3 /100 | #217 | Poor 5.5% |
| Afghans | 11.2 /100 | #218 | Poor 5.5% |
| Japanese | 9.8 /100 | #219 | Tragic 5.6% |
| Colombians | 9.2 /100 | #220 | Tragic 5.6% |
| Panamanians | 9.2 /100 | #221 | Tragic 5.6% |
| Cajuns | 6.9 /100 | #222 | Tragic 5.6% |
| Immigrants | Fiji | 6.7 /100 | #223 | Tragic 5.6% |
| Sudanese | 6.4 /100 | #224 | Tragic 5.6% |
| Immigrants | Cambodia | 6.1 /100 | #225 | Tragic 5.6% |
| South Americans | 5.7 /100 | #226 | Tragic 5.6% |
| Immigrants | Zaire | 5.6 /100 | #227 | Tragic 5.6% |
| Arabs | 5.4 /100 | #228 | Tragic 5.7% |