Immigrants from Belgium vs Slavic Female Poverty
COMPARE
Immigrants from Belgium
Slavic
Female Poverty
Female Poverty Comparison
Immigrants from Belgium
Slavs
12.2%
FEMALE POVERTY
97.7/ 100
METRIC RATING
70th/ 347
METRIC RANK
12.5%
FEMALE POVERTY
94.5/ 100
METRIC RATING
103rd/ 347
METRIC RANK
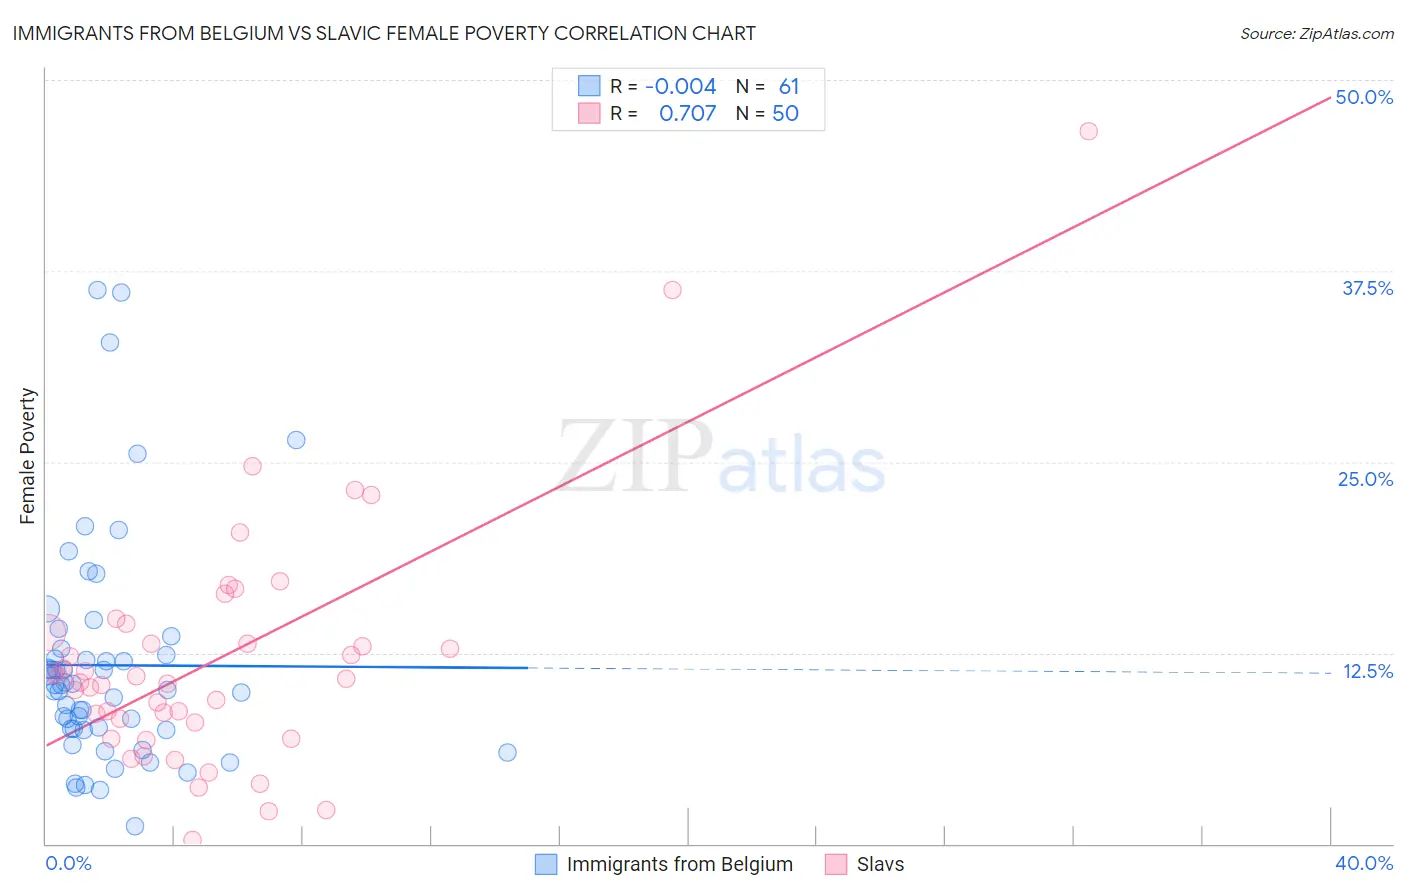
Immigrants from Belgium vs Slavic Female Poverty Correlation Chart
The statistical analysis conducted on geographies consisting of 146,675,363 people shows no correlation between the proportion of Immigrants from Belgium and poverty level among females in the United States with a correlation coefficient (R) of -0.004 and weighted average of 12.2%. Similarly, the statistical analysis conducted on geographies consisting of 270,757,305 people shows a strong positive correlation between the proportion of Slavs and poverty level among females in the United States with a correlation coefficient (R) of 0.707 and weighted average of 12.5%, a difference of 2.4%.
Female Poverty Correlation Summary
| Measurement | Immigrants from Belgium | Slavic |
| Minimum | 1.1% | 0.21% |
| Maximum | 36.2% | 46.6% |
| Range | 35.1% | 46.4% |
| Mean | 11.7% | 12.0% |
| Median | 10.4% | 10.7% |
| Interquartile 25% (IQ1) | 7.5% | 7.9% |
| Interquartile 75% (IQ3) | 12.6% | 13.8% |
| Interquartile Range (IQR) | 5.1% | 5.9% |
| Standard Deviation (Sample) | 7.3% | 8.1% |
| Standard Deviation (Population) | 7.3% | 8.0% |
Similar Demographics by Female Poverty
Demographics Similar to Immigrants from Belgium by Female Poverty
In terms of female poverty, the demographic groups most similar to Immigrants from Belgium are Swiss (12.2%, a difference of 0.030%), Immigrants from Netherlands (12.2%, a difference of 0.13%), Carpatho Rusyn (12.2%, a difference of 0.13%), Cambodian (12.2%, a difference of 0.16%), and Immigrants from Eastern Asia (12.2%, a difference of 0.17%).
| Demographics | Rating | Rank | Female Poverty |
| Ukrainians | 98.0 /100 | #63 | Exceptional 12.2% |
| Germans | 98.0 /100 | #64 | Exceptional 12.2% |
| Indians (Asian) | 97.9 /100 | #65 | Exceptional 12.2% |
| Austrians | 97.9 /100 | #66 | Exceptional 12.2% |
| Immigrants | Eastern Asia | 97.8 /100 | #67 | Exceptional 12.2% |
| Immigrants | Netherlands | 97.8 /100 | #68 | Exceptional 12.2% |
| Swiss | 97.7 /100 | #69 | Exceptional 12.2% |
| Immigrants | Belgium | 97.7 /100 | #70 | Exceptional 12.2% |
| Carpatho Rusyns | 97.6 /100 | #71 | Exceptional 12.2% |
| Cambodians | 97.5 /100 | #72 | Exceptional 12.2% |
| Zimbabweans | 97.5 /100 | #73 | Exceptional 12.3% |
| Immigrants | Canada | 97.5 /100 | #74 | Exceptional 12.3% |
| Europeans | 97.4 /100 | #75 | Exceptional 12.3% |
| Immigrants | Eastern Europe | 97.2 /100 | #76 | Exceptional 12.3% |
| Serbians | 97.2 /100 | #77 | Exceptional 12.3% |
Demographics Similar to Slavs by Female Poverty
In terms of female poverty, the demographic groups most similar to Slavs are Immigrants from China (12.5%, a difference of 0.020%), Palestinian (12.5%, a difference of 0.090%), Immigrants from Latvia (12.5%, a difference of 0.17%), Tlingit-Haida (12.5%, a difference of 0.17%), and Scottish (12.5%, a difference of 0.20%).
| Demographics | Rating | Rank | Female Poverty |
| British | 95.2 /100 | #96 | Exceptional 12.5% |
| Australians | 95.2 /100 | #97 | Exceptional 12.5% |
| Native Hawaiians | 95.1 /100 | #98 | Exceptional 12.5% |
| Romanians | 95.1 /100 | #99 | Exceptional 12.5% |
| Immigrants | Latvia | 94.8 /100 | #100 | Exceptional 12.5% |
| Tlingit-Haida | 94.8 /100 | #101 | Exceptional 12.5% |
| Immigrants | China | 94.5 /100 | #102 | Exceptional 12.5% |
| Slavs | 94.5 /100 | #103 | Exceptional 12.5% |
| Palestinians | 94.3 /100 | #104 | Exceptional 12.5% |
| Scottish | 94.1 /100 | #105 | Exceptional 12.5% |
| Immigrants | Turkey | 93.8 /100 | #106 | Exceptional 12.6% |
| Laotians | 93.4 /100 | #107 | Exceptional 12.6% |
| Portuguese | 93.1 /100 | #108 | Exceptional 12.6% |
| Immigrants | Zimbabwe | 93.1 /100 | #109 | Exceptional 12.6% |
| Paraguayans | 93.0 /100 | #110 | Exceptional 12.6% |