Immigrants from Belgium vs Immigrants from Iraq Female Poverty
COMPARE
Immigrants from Belgium
Immigrants from Iraq
Female Poverty
Female Poverty Comparison
Immigrants from Belgium
Immigrants from Iraq
12.2%
FEMALE POVERTY
97.7/ 100
METRIC RATING
70th/ 347
METRIC RANK
13.4%
FEMALE POVERTY
50.0/ 100
METRIC RATING
174th/ 347
METRIC RANK
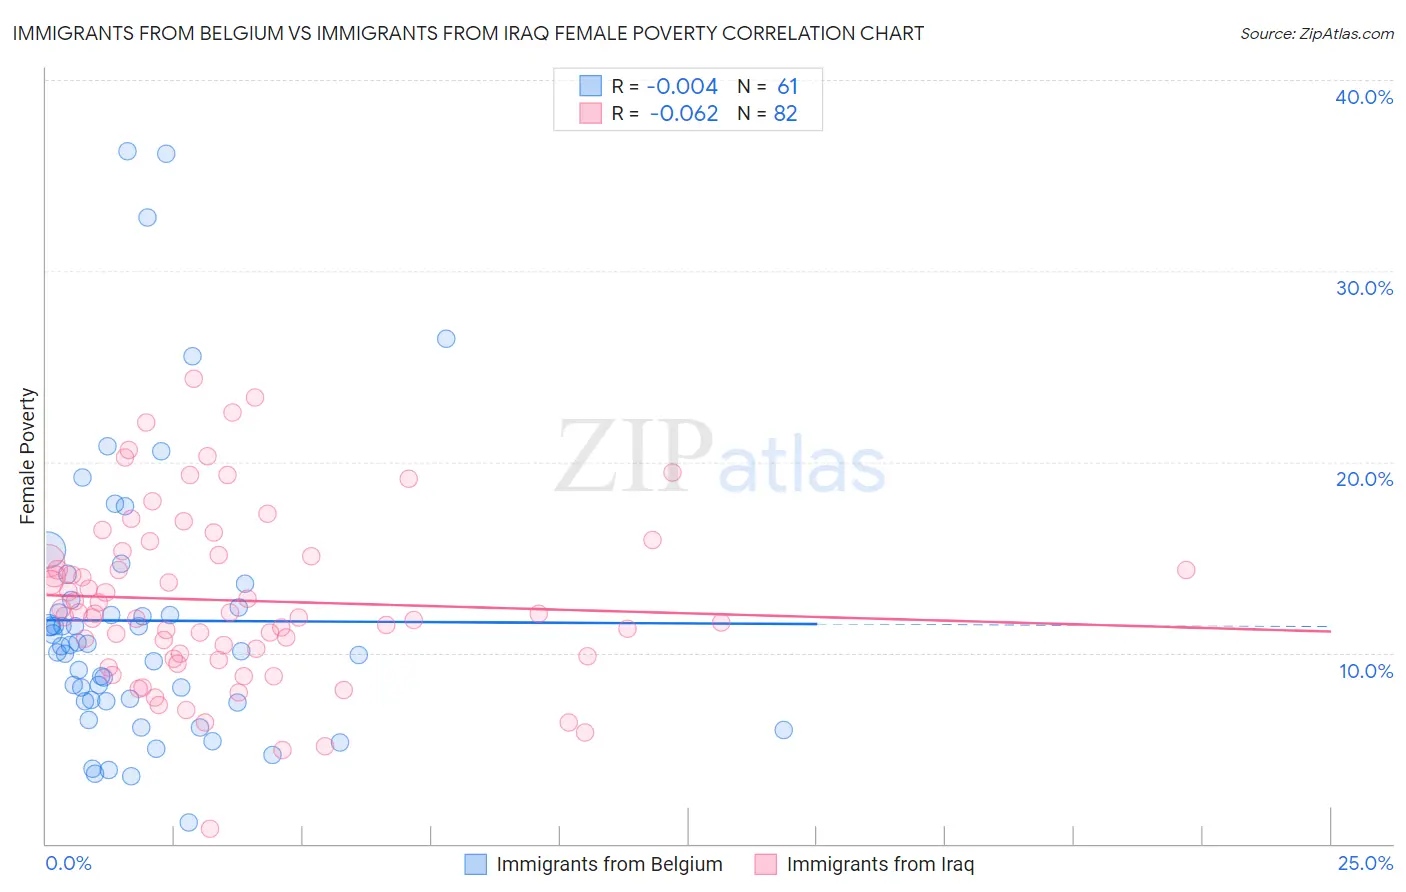
Immigrants from Belgium vs Immigrants from Iraq Female Poverty Correlation Chart
The statistical analysis conducted on geographies consisting of 146,675,363 people shows no correlation between the proportion of Immigrants from Belgium and poverty level among females in the United States with a correlation coefficient (R) of -0.004 and weighted average of 12.2%. Similarly, the statistical analysis conducted on geographies consisting of 194,711,025 people shows a slight negative correlation between the proportion of Immigrants from Iraq and poverty level among females in the United States with a correlation coefficient (R) of -0.062 and weighted average of 13.4%, a difference of 9.9%.
Female Poverty Correlation Summary
| Measurement | Immigrants from Belgium | Immigrants from Iraq |
| Minimum | 1.1% | 0.80% |
| Maximum | 36.2% | 24.3% |
| Range | 35.1% | 23.5% |
| Mean | 11.7% | 12.7% |
| Median | 10.4% | 12.1% |
| Interquartile 25% (IQ1) | 7.5% | 9.8% |
| Interquartile 75% (IQ3) | 12.6% | 15.1% |
| Interquartile Range (IQR) | 5.1% | 5.3% |
| Standard Deviation (Sample) | 7.3% | 4.5% |
| Standard Deviation (Population) | 7.3% | 4.5% |
Similar Demographics by Female Poverty
Demographics Similar to Immigrants from Belgium by Female Poverty
In terms of female poverty, the demographic groups most similar to Immigrants from Belgium are Swiss (12.2%, a difference of 0.030%), Immigrants from Netherlands (12.2%, a difference of 0.13%), Carpatho Rusyn (12.2%, a difference of 0.13%), Cambodian (12.2%, a difference of 0.16%), and Immigrants from Eastern Asia (12.2%, a difference of 0.17%).
| Demographics | Rating | Rank | Female Poverty |
| Ukrainians | 98.0 /100 | #63 | Exceptional 12.2% |
| Germans | 98.0 /100 | #64 | Exceptional 12.2% |
| Indians (Asian) | 97.9 /100 | #65 | Exceptional 12.2% |
| Austrians | 97.9 /100 | #66 | Exceptional 12.2% |
| Immigrants | Eastern Asia | 97.8 /100 | #67 | Exceptional 12.2% |
| Immigrants | Netherlands | 97.8 /100 | #68 | Exceptional 12.2% |
| Swiss | 97.7 /100 | #69 | Exceptional 12.2% |
| Immigrants | Belgium | 97.7 /100 | #70 | Exceptional 12.2% |
| Carpatho Rusyns | 97.6 /100 | #71 | Exceptional 12.2% |
| Cambodians | 97.5 /100 | #72 | Exceptional 12.2% |
| Zimbabweans | 97.5 /100 | #73 | Exceptional 12.3% |
| Immigrants | Canada | 97.5 /100 | #74 | Exceptional 12.3% |
| Europeans | 97.4 /100 | #75 | Exceptional 12.3% |
| Immigrants | Eastern Europe | 97.2 /100 | #76 | Exceptional 12.3% |
| Serbians | 97.2 /100 | #77 | Exceptional 12.3% |
Demographics Similar to Immigrants from Iraq by Female Poverty
In terms of female poverty, the demographic groups most similar to Immigrants from Iraq are Celtic (13.4%, a difference of 0.010%), Immigrants from Spain (13.4%, a difference of 0.010%), Immigrants from Morocco (13.4%, a difference of 0.060%), Immigrants from Afghanistan (13.4%, a difference of 0.070%), and Israeli (13.5%, a difference of 0.090%).
| Demographics | Rating | Rank | Female Poverty |
| Immigrants | Chile | 57.4 /100 | #167 | Average 13.3% |
| Aleuts | 56.7 /100 | #168 | Average 13.4% |
| Lebanese | 55.9 /100 | #169 | Average 13.4% |
| Colombians | 55.7 /100 | #170 | Average 13.4% |
| Whites/Caucasians | 54.6 /100 | #171 | Average 13.4% |
| Mongolians | 53.6 /100 | #172 | Average 13.4% |
| Immigrants | Afghanistan | 50.8 /100 | #173 | Average 13.4% |
| Immigrants | Iraq | 50.0 /100 | #174 | Average 13.4% |
| Celtics | 49.9 /100 | #175 | Average 13.4% |
| Immigrants | Spain | 49.9 /100 | #176 | Average 13.4% |
| Immigrants | Morocco | 49.4 /100 | #177 | Average 13.4% |
| Israelis | 49.1 /100 | #178 | Average 13.5% |
| Immigrants | Syria | 48.8 /100 | #179 | Average 13.5% |
| South Americans | 44.8 /100 | #180 | Average 13.5% |
| Venezuelans | 44.5 /100 | #181 | Average 13.5% |