Immigrants from Albania vs Chippewa Single Female Poverty
COMPARE
Immigrants from Albania
Chippewa
Single Female Poverty
Single Female Poverty Comparison
Immigrants from Albania
Chippewa
19.4%
SINGLE FEMALE POVERTY
99.2/ 100
METRIC RATING
85th/ 347
METRIC RANK
26.8%
SINGLE FEMALE POVERTY
0.0/ 100
METRIC RATING
323rd/ 347
METRIC RANK
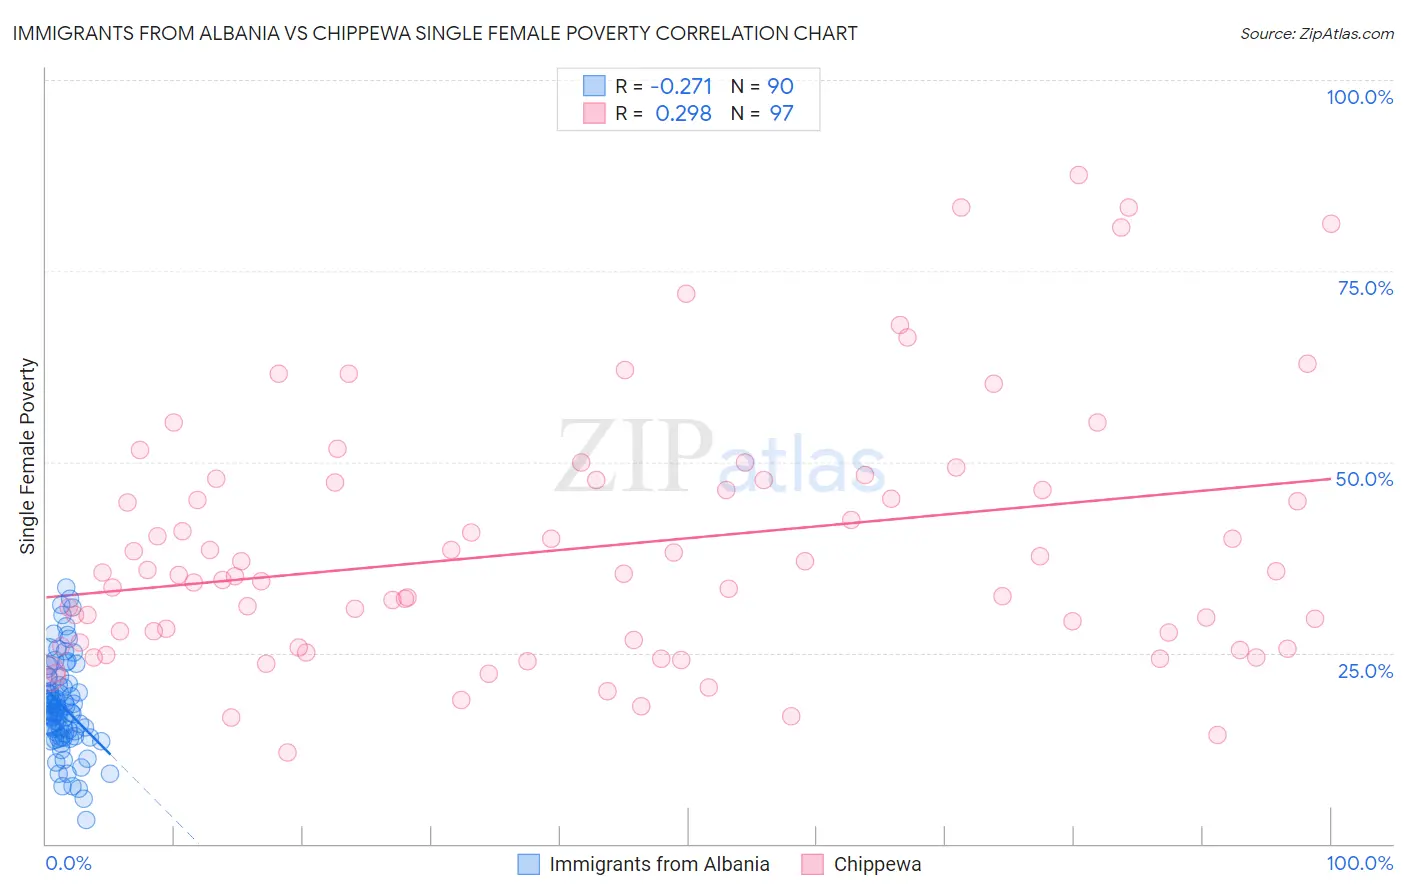
Immigrants from Albania vs Chippewa Single Female Poverty Correlation Chart
The statistical analysis conducted on geographies consisting of 118,461,205 people shows a weak negative correlation between the proportion of Immigrants from Albania and poverty level among single females in the United States with a correlation coefficient (R) of -0.271 and weighted average of 19.4%. Similarly, the statistical analysis conducted on geographies consisting of 213,087,028 people shows a weak positive correlation between the proportion of Chippewa and poverty level among single females in the United States with a correlation coefficient (R) of 0.298 and weighted average of 26.8%, a difference of 38.0%.
Single Female Poverty Correlation Summary
| Measurement | Immigrants from Albania | Chippewa |
| Minimum | 3.1% | 11.9% |
| Maximum | 33.6% | 87.6% |
| Range | 30.4% | 75.7% |
| Mean | 17.9% | 38.7% |
| Median | 17.2% | 35.2% |
| Interquartile 25% (IQ1) | 14.0% | 26.1% |
| Interquartile 75% (IQ3) | 20.9% | 47.5% |
| Interquartile Range (IQR) | 6.9% | 21.4% |
| Standard Deviation (Sample) | 6.1% | 16.5% |
| Standard Deviation (Population) | 6.0% | 16.4% |
Similar Demographics by Single Female Poverty
Demographics Similar to Immigrants from Albania by Single Female Poverty
In terms of single female poverty, the demographic groups most similar to Immigrants from Albania are Greek (19.4%, a difference of 0.0%), Immigrants from Sweden (19.4%, a difference of 0.040%), Taiwanese (19.4%, a difference of 0.12%), Immigrants from Malaysia (19.4%, a difference of 0.13%), and Immigrants from Scotland (19.4%, a difference of 0.14%).
| Demographics | Rating | Rank | Single Female Poverty |
| Albanians | 99.3 /100 | #78 | Exceptional 19.4% |
| Immigrants | Sierra Leone | 99.3 /100 | #79 | Exceptional 19.4% |
| Immigrants | Australia | 99.3 /100 | #80 | Exceptional 19.4% |
| Immigrants | Scotland | 99.2 /100 | #81 | Exceptional 19.4% |
| Immigrants | Malaysia | 99.2 /100 | #82 | Exceptional 19.4% |
| Taiwanese | 99.2 /100 | #83 | Exceptional 19.4% |
| Immigrants | Sweden | 99.2 /100 | #84 | Exceptional 19.4% |
| Immigrants | Albania | 99.2 /100 | #85 | Exceptional 19.4% |
| Greeks | 99.2 /100 | #86 | Exceptional 19.4% |
| Zimbabweans | 99.0 /100 | #87 | Exceptional 19.5% |
| Afghans | 99.0 /100 | #88 | Exceptional 19.5% |
| Immigrants | Ukraine | 99.0 /100 | #89 | Exceptional 19.5% |
| Immigrants | Lebanon | 98.8 /100 | #90 | Exceptional 19.6% |
| Soviet Union | 98.8 /100 | #91 | Exceptional 19.6% |
| Italians | 98.8 /100 | #92 | Exceptional 19.6% |
Demographics Similar to Chippewa by Single Female Poverty
In terms of single female poverty, the demographic groups most similar to Chippewa are Seminole (26.8%, a difference of 0.10%), Kiowa (26.9%, a difference of 0.41%), Yup'ik (26.6%, a difference of 0.84%), Choctaw (27.2%, a difference of 1.4%), and Arapaho (26.4%, a difference of 1.5%).
| Demographics | Rating | Rank | Single Female Poverty |
| Immigrants | Somalia | 0.0 /100 | #316 | Tragic 25.8% |
| Ottawa | 0.0 /100 | #317 | Tragic 26.0% |
| Chickasaw | 0.0 /100 | #318 | Tragic 26.3% |
| Blacks/African Americans | 0.0 /100 | #319 | Tragic 26.4% |
| Arapaho | 0.0 /100 | #320 | Tragic 26.4% |
| Yup'ik | 0.0 /100 | #321 | Tragic 26.6% |
| Seminole | 0.0 /100 | #322 | Tragic 26.8% |
| Chippewa | 0.0 /100 | #323 | Tragic 26.8% |
| Kiowa | 0.0 /100 | #324 | Tragic 26.9% |
| Choctaw | 0.0 /100 | #325 | Tragic 27.2% |
| Creek | 0.0 /100 | #326 | Tragic 27.4% |
| Dutch West Indians | 0.0 /100 | #327 | Tragic 27.5% |
| Apache | 0.0 /100 | #328 | Tragic 27.7% |
| Menominee | 0.0 /100 | #329 | Tragic 27.8% |
| Hopi | 0.0 /100 | #330 | Tragic 28.0% |