Icelander vs Korean Family Poverty
COMPARE
Icelander
Korean
Family Poverty
Family Poverty Comparison
Icelanders
Koreans
8.3%
FAMILY POVERTY
90.3/ 100
METRIC RATING
126th/ 347
METRIC RANK
7.8%
FAMILY POVERTY
98.3/ 100
METRIC RATING
64th/ 347
METRIC RANK
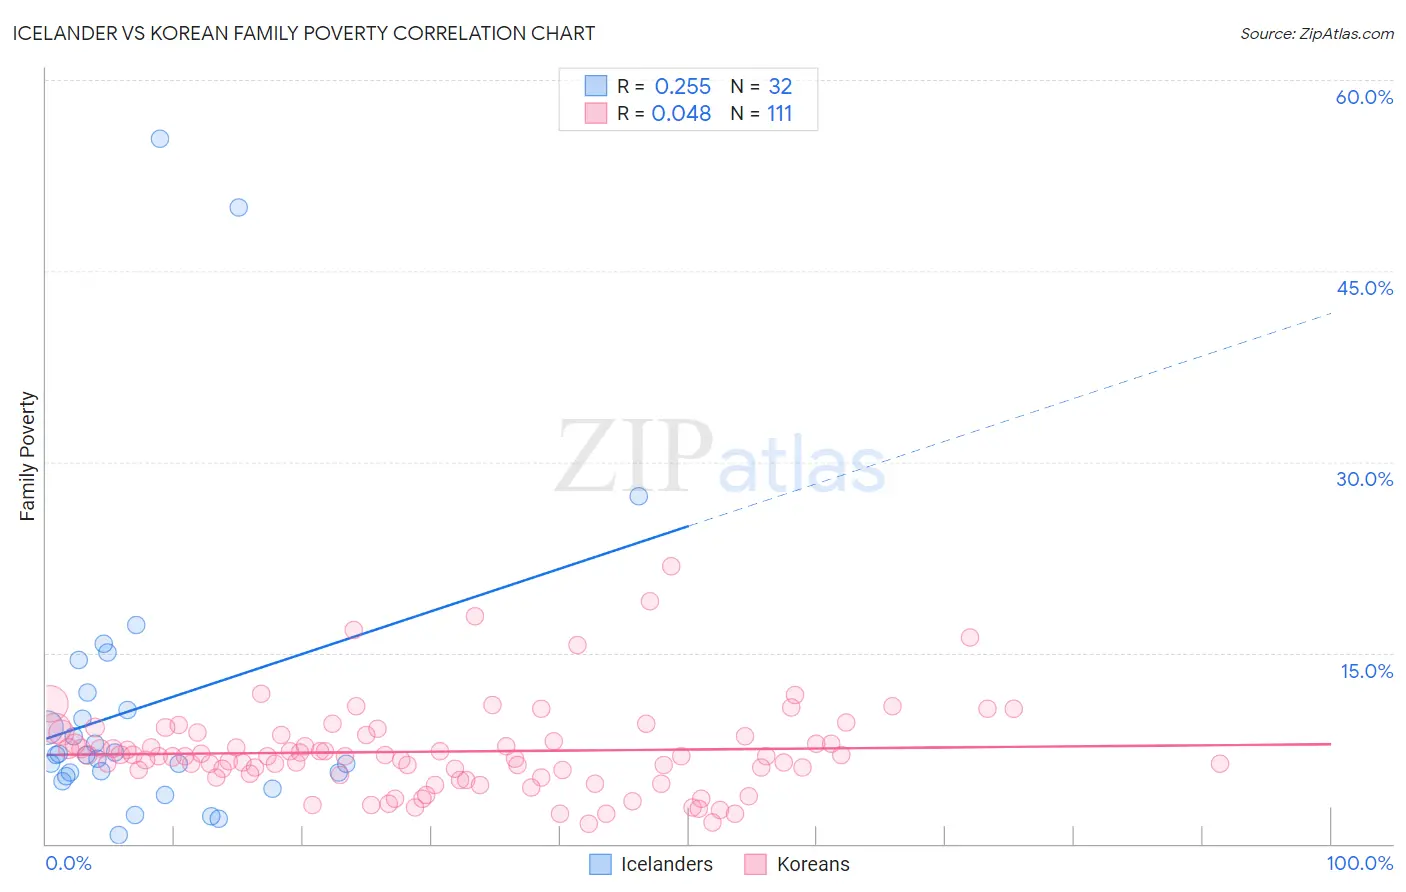
Icelander vs Korean Family Poverty Correlation Chart
The statistical analysis conducted on geographies consisting of 159,459,929 people shows a weak positive correlation between the proportion of Icelanders and poverty level among families in the United States with a correlation coefficient (R) of 0.255 and weighted average of 8.3%. Similarly, the statistical analysis conducted on geographies consisting of 508,576,179 people shows no correlation between the proportion of Koreans and poverty level among families in the United States with a correlation coefficient (R) of 0.048 and weighted average of 7.8%, a difference of 6.9%.
Family Poverty Correlation Summary
| Measurement | Icelander | Korean |
| Minimum | 0.72% | 1.6% |
| Maximum | 55.4% | 21.8% |
| Range | 54.6% | 20.2% |
| Mean | 10.9% | 7.2% |
| Median | 7.0% | 6.9% |
| Interquartile 25% (IQ1) | 5.4% | 5.4% |
| Interquartile 75% (IQ3) | 11.2% | 8.6% |
| Interquartile Range (IQR) | 5.7% | 3.2% |
| Standard Deviation (Sample) | 12.2% | 3.5% |
| Standard Deviation (Population) | 12.0% | 3.5% |
Similar Demographics by Family Poverty
Demographics Similar to Icelanders by Family Poverty
In terms of family poverty, the demographic groups most similar to Icelanders are Immigrants from Hungary (8.4%, a difference of 0.13%), Pakistani (8.3%, a difference of 0.20%), Soviet Union (8.3%, a difference of 0.24%), Argentinean (8.4%, a difference of 0.27%), and Palestinian (8.3%, a difference of 0.34%).
| Demographics | Rating | Rank | Family Poverty |
| French | 92.8 /100 | #119 | Exceptional 8.3% |
| Immigrants | Egypt | 91.6 /100 | #120 | Exceptional 8.3% |
| Native Hawaiians | 91.3 /100 | #121 | Exceptional 8.3% |
| Paraguayans | 91.2 /100 | #122 | Exceptional 8.3% |
| Palestinians | 91.1 /100 | #123 | Exceptional 8.3% |
| Soviet Union | 90.8 /100 | #124 | Exceptional 8.3% |
| Pakistanis | 90.8 /100 | #125 | Exceptional 8.3% |
| Icelanders | 90.3 /100 | #126 | Exceptional 8.3% |
| Immigrants | Hungary | 89.9 /100 | #127 | Excellent 8.4% |
| Argentineans | 89.6 /100 | #128 | Excellent 8.4% |
| Portuguese | 89.2 /100 | #129 | Excellent 8.4% |
| Immigrants | Bosnia and Herzegovina | 88.6 /100 | #130 | Excellent 8.4% |
| Puget Sound Salish | 88.6 /100 | #131 | Excellent 8.4% |
| Immigrants | Argentina | 88.2 /100 | #132 | Excellent 8.4% |
| Sri Lankans | 86.6 /100 | #133 | Excellent 8.5% |
Demographics Similar to Koreans by Family Poverty
In terms of family poverty, the demographic groups most similar to Koreans are Immigrants from Bulgaria (7.8%, a difference of 0.010%), Dutch (7.8%, a difference of 0.070%), Northern European (7.8%, a difference of 0.080%), Australian (7.8%, a difference of 0.12%), and Immigrants from Belgium (7.8%, a difference of 0.13%).
| Demographics | Rating | Rank | Family Poverty |
| Asians | 98.7 /100 | #57 | Exceptional 7.7% |
| Finns | 98.7 /100 | #58 | Exceptional 7.7% |
| Europeans | 98.7 /100 | #59 | Exceptional 7.7% |
| Immigrants | Greece | 98.7 /100 | #60 | Exceptional 7.7% |
| Immigrants | Netherlands | 98.6 /100 | #61 | Exceptional 7.7% |
| Macedonians | 98.6 /100 | #62 | Exceptional 7.8% |
| Zimbabweans | 98.4 /100 | #63 | Exceptional 7.8% |
| Koreans | 98.3 /100 | #64 | Exceptional 7.8% |
| Immigrants | Bulgaria | 98.3 /100 | #65 | Exceptional 7.8% |
| Dutch | 98.3 /100 | #66 | Exceptional 7.8% |
| Northern Europeans | 98.3 /100 | #67 | Exceptional 7.8% |
| Australians | 98.2 /100 | #68 | Exceptional 7.8% |
| Immigrants | Belgium | 98.2 /100 | #69 | Exceptional 7.8% |
| Immigrants | Canada | 98.2 /100 | #70 | Exceptional 7.8% |
| Cambodians | 98.2 /100 | #71 | Exceptional 7.8% |