Icelander vs Immigrants from Congo Family Poverty
COMPARE
Icelander
Immigrants from Congo
Family Poverty
Family Poverty Comparison
Icelanders
Immigrants from Congo
8.3%
FAMILY POVERTY
90.3/ 100
METRIC RATING
126th/ 347
METRIC RANK
11.9%
FAMILY POVERTY
0.0/ 100
METRIC RATING
307th/ 347
METRIC RANK
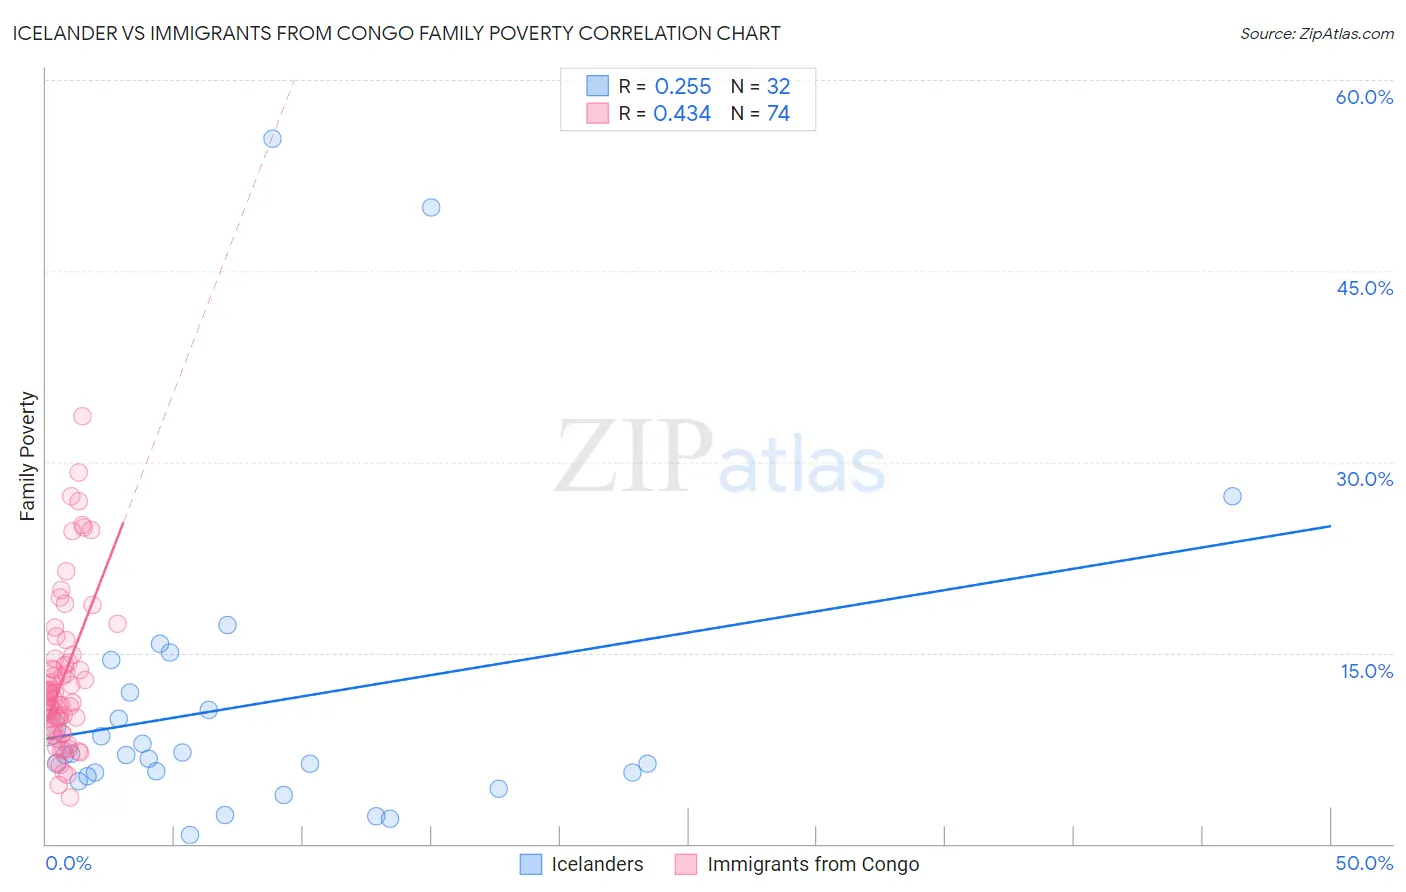
Icelander vs Immigrants from Congo Family Poverty Correlation Chart
The statistical analysis conducted on geographies consisting of 159,459,929 people shows a weak positive correlation between the proportion of Icelanders and poverty level among families in the United States with a correlation coefficient (R) of 0.255 and weighted average of 8.3%. Similarly, the statistical analysis conducted on geographies consisting of 92,062,434 people shows a moderate positive correlation between the proportion of Immigrants from Congo and poverty level among families in the United States with a correlation coefficient (R) of 0.434 and weighted average of 11.9%, a difference of 42.5%.
Family Poverty Correlation Summary
| Measurement | Icelander | Immigrants from Congo |
| Minimum | 0.72% | 3.6% |
| Maximum | 55.4% | 33.5% |
| Range | 54.6% | 29.9% |
| Mean | 10.9% | 13.1% |
| Median | 7.0% | 11.6% |
| Interquartile 25% (IQ1) | 5.4% | 9.0% |
| Interquartile 75% (IQ3) | 11.2% | 14.5% |
| Interquartile Range (IQR) | 5.7% | 5.5% |
| Standard Deviation (Sample) | 12.2% | 6.1% |
| Standard Deviation (Population) | 12.0% | 6.1% |
Similar Demographics by Family Poverty
Demographics Similar to Icelanders by Family Poverty
In terms of family poverty, the demographic groups most similar to Icelanders are Immigrants from Hungary (8.4%, a difference of 0.13%), Pakistani (8.3%, a difference of 0.20%), Soviet Union (8.3%, a difference of 0.24%), Argentinean (8.4%, a difference of 0.27%), and Palestinian (8.3%, a difference of 0.34%).
| Demographics | Rating | Rank | Family Poverty |
| French | 92.8 /100 | #119 | Exceptional 8.3% |
| Immigrants | Egypt | 91.6 /100 | #120 | Exceptional 8.3% |
| Native Hawaiians | 91.3 /100 | #121 | Exceptional 8.3% |
| Paraguayans | 91.2 /100 | #122 | Exceptional 8.3% |
| Palestinians | 91.1 /100 | #123 | Exceptional 8.3% |
| Soviet Union | 90.8 /100 | #124 | Exceptional 8.3% |
| Pakistanis | 90.8 /100 | #125 | Exceptional 8.3% |
| Icelanders | 90.3 /100 | #126 | Exceptional 8.3% |
| Immigrants | Hungary | 89.9 /100 | #127 | Excellent 8.4% |
| Argentineans | 89.6 /100 | #128 | Excellent 8.4% |
| Portuguese | 89.2 /100 | #129 | Excellent 8.4% |
| Immigrants | Bosnia and Herzegovina | 88.6 /100 | #130 | Excellent 8.4% |
| Puget Sound Salish | 88.6 /100 | #131 | Excellent 8.4% |
| Immigrants | Argentina | 88.2 /100 | #132 | Excellent 8.4% |
| Sri Lankans | 86.6 /100 | #133 | Excellent 8.5% |
Demographics Similar to Immigrants from Congo by Family Poverty
In terms of family poverty, the demographic groups most similar to Immigrants from Congo are Seminole (11.9%, a difference of 0.060%), Cajun (11.9%, a difference of 0.11%), Hispanic or Latino (12.0%, a difference of 0.50%), Immigrants from Guatemala (12.0%, a difference of 0.51%), and Mexican (11.8%, a difference of 0.67%).
| Demographics | Rating | Rank | Family Poverty |
| Immigrants | Bangladesh | 0.0 /100 | #300 | Tragic 11.7% |
| Bahamians | 0.0 /100 | #301 | Tragic 11.7% |
| Guatemalans | 0.0 /100 | #302 | Tragic 11.7% |
| Africans | 0.0 /100 | #303 | Tragic 11.8% |
| Immigrants | Latin America | 0.0 /100 | #304 | Tragic 11.8% |
| Mexicans | 0.0 /100 | #305 | Tragic 11.8% |
| Cajuns | 0.0 /100 | #306 | Tragic 11.9% |
| Immigrants | Congo | 0.0 /100 | #307 | Tragic 11.9% |
| Seminole | 0.0 /100 | #308 | Tragic 11.9% |
| Hispanics or Latinos | 0.0 /100 | #309 | Tragic 12.0% |
| Immigrants | Guatemala | 0.0 /100 | #310 | Tragic 12.0% |
| Ute | 0.0 /100 | #311 | Tragic 12.1% |
| Immigrants | Central America | 0.0 /100 | #312 | Tragic 12.1% |
| Immigrants | Caribbean | 0.0 /100 | #313 | Tragic 12.2% |
| Kiowa | 0.0 /100 | #314 | Tragic 12.2% |